|
System Views
Jigsaw presents the individual reports in a document collection and
the entities within those reports through a series of visualizations.
We call these visualizations the system views. Below, we illustrate
each view provided by the system and briefly describe their
characteristics. Click on the individual images to see a larger
version of the view. Also, a tutorial
video illustrates the different views as well and the interactive
behavior for each view can be seen on the video
tutorial page.
All views share a Bookmarks menu which has commands to save any window
and its state for resumption later. Also, in
the upper right corner of a view is a small icon showing a satellite
dish. This icon indicates that view is listening for system events
and will update its presentation as new events occur. When the user
clicks on this icon, a red line is drawn through it to indicates that
the view is no longer listening to system events and thus will only
change what is shown by direct interaction from the user. The icon is
a toggle button so that clicking on it again will turn event listening
back on.
Views in Jigsaw often show connections between entities across the
document collection. Two entities are considered to be "connected" if
they appear in at least one document together. Entities are
considered more strongly connected as they appear in more and more
documents together.
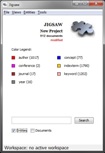 Control Panel - The Control Panel provides a variety of menu
commands for use in the system and a search bar in which the user can
enter strings to be searched, either as parts of entity names or as
plain text in the documents. When a valid entity from the system is
queried, all the visible
views display that entity in the appropriate context of that view.
When a plain text term is entered, all documents containing that term
are loaded in the Document View. The Control Panel also displays
number of documents in the collection being investigated, the
different types of entities (each assigned a unique color), and the
number of entities found of each type.
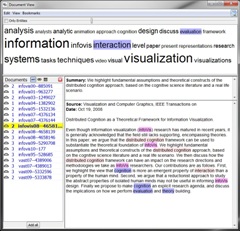 Document View - The Document View presents a set of documents
from the collection. A list of the
loaded documents is shown to the lower left, and the one currently selected
for viewing is highlighted in yellow (its text is shown to the right).
Every time a document is
viewed, a counter increments to help the investigator keep track of
readings. All the documents with grayed-in clouds in the left list
contribute toward the word cloud at the top of the view which presents
the key terms being mentioned across this set of documents. In the
actual selected document view, named entities are colored in a
background pastel shade of the entity color type shown in the Control
Panel. The one sentence from the document that "best summarizes" the
document is shown above the actual document text.
 List View - The List View presents a set of lists of entities
of different types. The user can add and remove lists through a menu
command. Thus, a wider view window can support the display of more
lists. At the top of each list are a set of buttons and a menu for
controlling the appearance of the list. The menu allows the user to
designate what entity type should be shown in that list. Note that
the same entity type can be shown in multiple lists. Different
buttons control features such as the justification of entities in the
list (left, center, right) and the ordering of entities. Entities can
be listed alphabetically, by frequency of appearance across the document
collection, or by strength of connection to the selected entities
The small black bars to the left of the entities
indicate each entity's frequency of appearance across the collection
as well.
When the user clicks on an entity, it is "selected" and shown with a
yellow background. Multiple entities can be selected within and
across lists using control-click and shift-click as well. When an
item or items are selected, all of the other entities update their
appearance. If an entity is not connected to any of the selected
entities, it is shown in the default white background. Entities that
are connected to at least one of the selected items are shown with an
orange background. Stronger connections are indicated by darker
shades of orange. In addition, connected items in neighboring lists
can be joined by lines to further indicate individual connections. As
a list becomes longer and longer, many items may not be visible in the
view. Consequently, a button is provided at the top of each list to
bring all selected and connected items up to the top of the list.
The default display mode is "OR". That is, when multiple entities are
selected, other entities connected to any one or more of those
selected ones are colored in orange. The viewer can change the mode
to "AND" via a button in the upper right which means that only
entities connected to each and every one of the selected items will be
colored in orange.
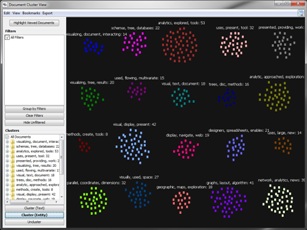 Document Cluster View - The Document Cluster View represents all
the documents in the collection as
small rectangles. The user can drag and move individual documents or
sets of documents to make different clusters. In addition,
each query issued in the control panel adds a filter to the upper left
region. The documents then can be segregated depending upon which of
those terms they contain (different groups are assigned different
colors). The View also contains buttons in the lower left to
automatically cluster, based on similarity, the documents based on the
source text of each
document or the sets of entities per document.
The button in the top left will highlight (via a yellow outline) all
the documents in the collection that the analyst has read so far.
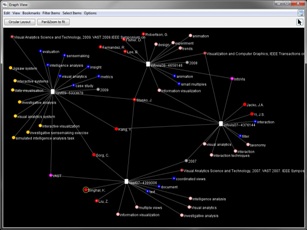 Graph View - The Graph View presents documents and the entities
within them through a traditional node-link graph visualization.
Rather than drawing the entire document/entity collection through one
graph layout, Jigsaw provides an interactive exploration-style Graph View.
Documents are slightly larger white rectangles and entities are slightly
smaller circles, colored by the entity type. The entities within a
document are usually drawn as a cloud around the document in which
they appear. An entity is only ever drawn once, however, so entities
in multiple documents are indicated by one circle that is connected to
different documents (rectangles). When the user searches for an entity or
issues an entity "show" command, that entity is added to the view.
The view is interactive so that the user can click on any document or
entity and drag it to a new location. Dragging a document brings with
it all the entities only connected to it. (Entities connected to other
documents as well retain their position during such a move, however.)
Double-clicking on a document is a toggle-style command that
either shows or hides the entities connected to that document.
Double-clicking on an entity displays all the different documents in
which it appears.
When new entities are added to a crowded view, they may be positioned
outside the current visible area, but the Jigsaw Graph View will
automatically zoom out to make sure all are visible after the
command. The Graph View also contains one special layout command,
"Circular Layout", that will reposition all the items in the view.
Document rectangles are drawn at equally spaced positions around a
large logical
circle in the view. All the entities only appearing in one document
are drawn outside the logical circle but near that document. Entities
appearing in more than one document are drawn inside the circle.
Entities appearing in the most documents are drawn closer to the
center. The view contains many menu commands for filtering (showing
and hiding) different types of entities as well.
 Document Grid View - The Document Grid View represents all
the documents in the collection as small rectangles in a grid. The
analyst can control the ordering of rectangles (top-left to
botoom-right) and the shading/color of the rectangles. Each of these
attributes can be mapped to document atttributes such as the size,
number of entities, or date. Additionally, a particular document can
be selected as the focus and then all other document's similarity to
it is another attribute to be visualized. Jigsaw also can perform a
sentiment analysis of the documents and this atttribute can be
represented (blue-positive, red-negative). By selecting the button in
the upper left, the grid is segregated into regions corresponding to
different clusters of doucments as computed by Jigsaw, and then the
color and ordering are shown within each cluster.
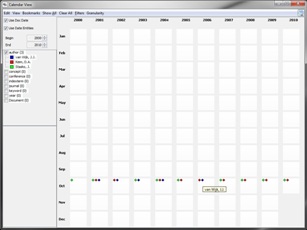 Calendar View - The Calendar View presents different documents
and entities from the data set in the context of a familiar calendar
view. In the detailed view mode, the view shows years, months, weeks
and days. In the more coarse view (shown here), the view just shows
months and years. The small diamond items
drawn on a particular day/month represent documents (gray) or entities
(color mapping) in the context of the date(s) noted in document in
which they appear. Documents or entities that are available to be
shown in the Calendar are listed in the upper left. The default for
an item is not to be visible. By clicking on the item's name, the
user can make it visible and add it to the calendar. The color of an
item can be changed
from its default entity type color to help differentiate different
entities too. When the number of items associated with a day is
too large to all be drawn in that region, a number is drawn
indicating how many others appear on that day. As the user moves the
mouse over that day, a larger rectangle pops up and shows all the
items. When the user moves a the mouse cursor over a
document-representation diamond drawn
in the calendar, all the entities appearing in that document are shown
on the lower left.
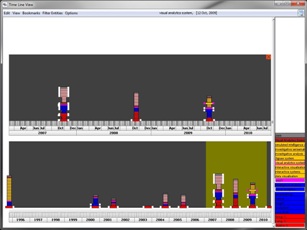 Timeline View - The Timeline View shows documents in
the context of a timeline representation. Each document is
represented by a "tower" of segments, each segment (thin horizontal
slice) represents the
entities within that document. When the viewer sweeps out a smaller
region on a timeline with the mouse, that region is drawn above in
more detail. This operation can be repeated multiple times to allow
the viewer to see finer and finer context of a particular segment of
time.
 WordTree View - The WordTree View is adapted from the Word Tree
visualization introduced by IBM researchers in the Many
Eyes system. The viewer can enter at the top a word or words that
appears in the document collection. The view then shows the context
of that word,
that is, the view shows all the trailing words that follow the search
term(s) anywhere in the collection. Size indicates frequency, so larger
branches indicate more repeated text usage. The Jigsaw WordTree View
allows the user to see all trailing expressions (so the view may need
to scroll vertically) or the results can be compressed and filtered to
all fit in the current view without scrolling. This view helps
the investigator to understand the context of a particular word or set of
words in the document collection.
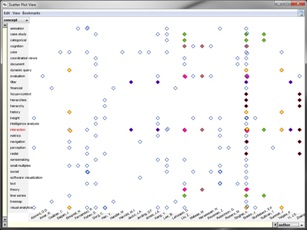 Scatterplot View - The Scatterplot View allows an analyst to
place two different entity types on the two axes. Individual entities
then can be filled in on the axes through search queries and
interactive "show" commands. When a pairing of a
plotted entity from the x axis and from a plotted entity on the y axis corresponds to a
connection (ie, the two entities appear together in a document or documents),
then a diamond is drawn at the crossing of their respective horizontal
and vertical positions to represent that document containing both.
The user can also assign particular colors to the different documents
so that s/he can more easily see the different entity-entity pairings
in a document. When an axis becomes crowded from too many entities
being drawn on it, the user can use the two range sliders to narrow in
on a particular region of the axis.
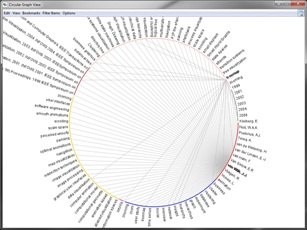 Circular Graph View - The Circular Graph View plots different
entities from the collection around the circumference of a circle.
Different entity types are grouped in different regions of the
circumference (indicated by color). By clicking on an entity name,
the investigator selects it (shown in bold) and lines are drawn to all
of the connected entities. Multiple entities can be selected via
control-click of the mouse button.
 Tablet - The Tablet is not really a document/entity
view like the others above. Instead, it is a window with Jigsaw that
provides some basic evidence marshalling
support and functions as an electronic notebook or tablet where the
analyst can take notes, develop hypotheses, and organize his/her
thoughts. The investigator can add relevant entities and documents from other
views to the Tablet. These added items then can be linked together
via lines (eg, to show a social network), can be connected to a
timeline, or can have notes connected to them. Additionally, the
state of different views in Jigsaw can be "bookmarked" and added to
the Tablet. That state then can be recreated via this item. The Tablet also
supports multiple tabs/windows to manage different parts of the
investigation.
Last
modified: January 18, 2011 |

![]()


