
Graphs and Tables of the Results
Table of Contents
We've got a ton of graphs (over 200) presented in as consistent manner as possible.
For those of you who want a printed version of the results,
hardcopy is also available.
All graphs are available via anonymous ftp via
ftp.cc.gatech.edu in
/pub/gvu/www/survey/survey-10-1995. New questions not asked in previous
surveys are denoted by the  icon. The questions for
the survey are arranged into the following categories:
icon. The questions for
the survey are arranged into the following categories:
How to Access the Information
Specifically, we present graphically the results to each question (over
50 questions) on a percentage basis, comparing the following groups of
users (stratified samples):
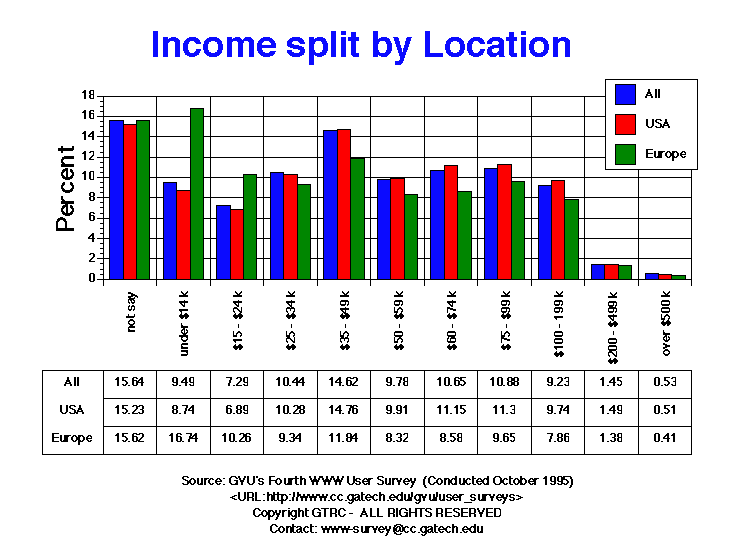
- [L] the entire sample vs European vs US users
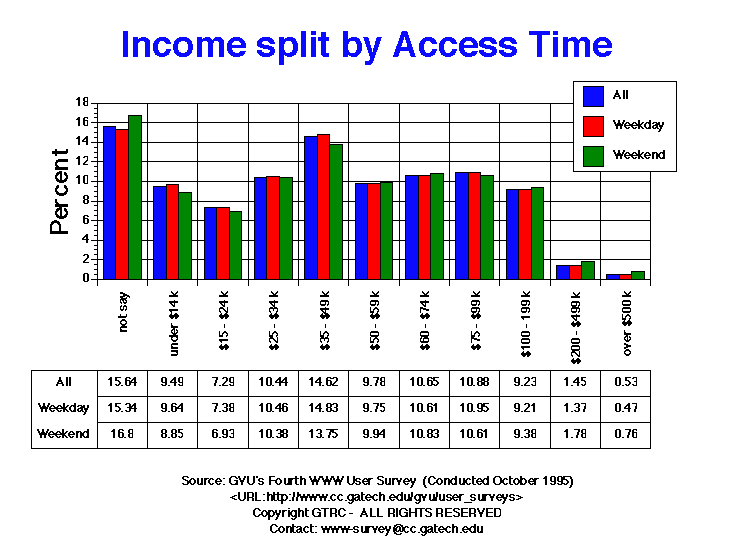
- [A] the entire sample vs Weekday vs Weekend users
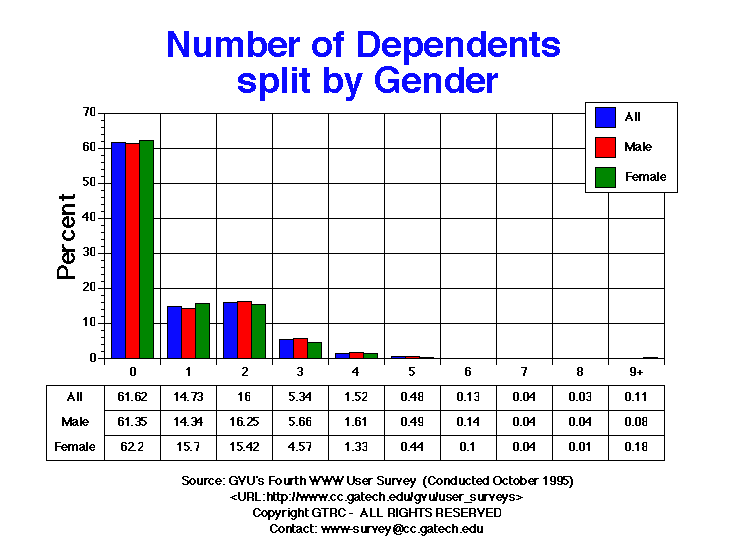
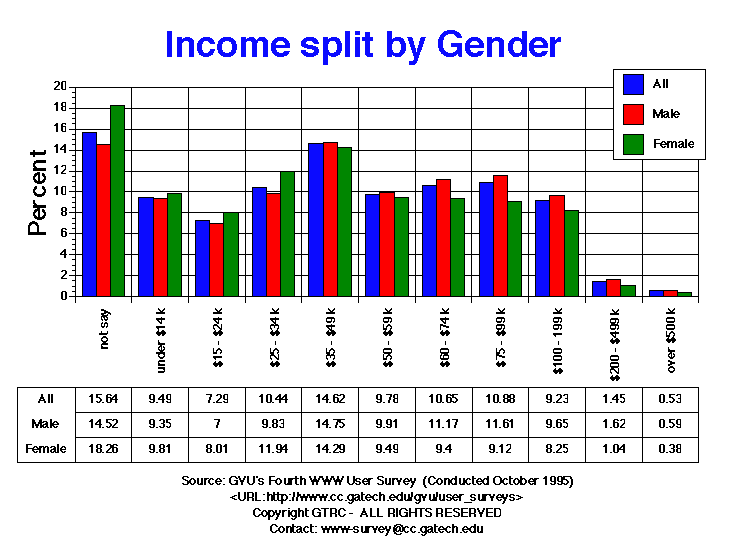
- [G] the entire sample vs Female vs Male users
- [T] Table of Data for the all samples (Entire, European, US, Weekday, Weekend, Female, Male)
To access all graphs and interpretations for each question, click on the
question (the rightmost hyperlink). Access to each of the stratified samples
is possible by the [L A G T] key to the left of each question. Click on:
- L - to access only the Location comparison graph
- A - to access only the Access Time comparison graph
- G - to access only the Gender comparison graph
- T - to access the Frequency/Percentage table graph
Tests for significant differences between stratified samples, correlations
between factors, and comparisons between data from the Fourth Survey, and the
last Third Survey are forthcoming.
All graphs are interlaced GIFs and were created using Delta Graph Professional
for the Macintosh, and converted into GIF format using GIFConverter. The data
used for these graphs was generated from summary statistics processed via
Splus version 3.3 for UNIX.
General Demographics
- All Below Questions Had 23,348 Respondents
Personal Computing Questions
- All Below Questions Had 23,348 Respondents
Internet Related Questions
- Number of Respondents Varies Between 23,348 & 14,475
WWW Based Questions
- Number of Respondents Varies Between 23,348 & 14,475
Frequency of Web Use/Behaviors
- All Below Questions Had 14,475 Respondents
User Preferences
- All Below Questions Had 14,475 Respondents
Consumer Surveys
- Number of Respondents Varies Between 6,509 and 3,631
Learning of HTML
- All Below Questions Had 5,301 Respondents
HTML Authors
- All Below Questions Had 5,301 Respondents
Webmasters
- All Below Questions Had 2,003 Respondents
Web Service Providers
- All Below Questions Had 1209 Respondents/Companies 
