

This seminar wil introduce SGI CASEvision, a powerful set of software debugging, design, and performance analysis tools with a graphical interface. CASEvision has the capability of debugging and analyzing all types of code including parallel and graphics codes.
We will examine a selection of the CASEVision Tools:
WorkShop
We will examine:
then,
We'll debug an application
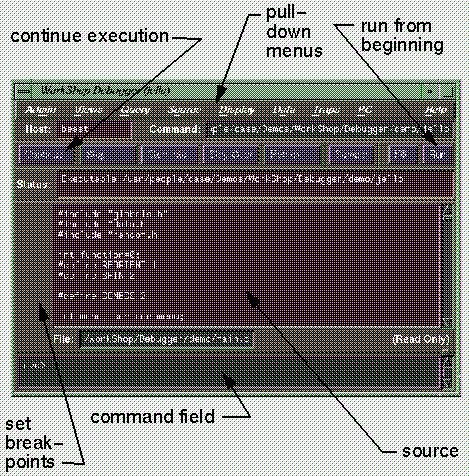
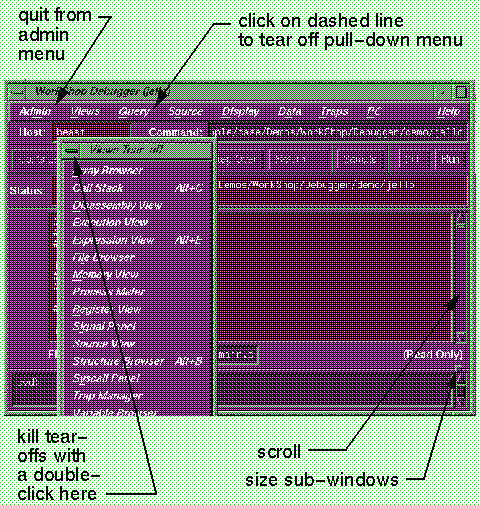
We're debugging a GL demo program. Let's explore some basic features.
Display-> Show Line Numbers
Set breakpoint at line 134 (use scrollbar on right, click in left margin)
Click on "Run"
Program will stop at line 134.
Select Views->Call Stack
Expand windows if neccessary. The Call stack window shows the sequence of calls up to this point. Play with the Display menu to control what data is displayed.
Select Views->Variable Browser
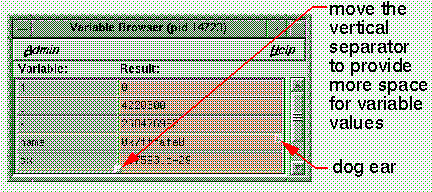
The Variable browser shows local variables and passed arguments.
In Variable Browser, in the result field of variable "name", click right mouse button and choose Value->string.
Expand window so that you can see the whole string.
Click on the dog ear. This lets you see the previous value. Click again to see current value.
In the Call Stack window, double click on some of the other lines. The Variable Browser is updated.
Values are changed by typing in the value field. Edit the value of k.
Hit the Step Over button several times. Notice that the program stops after the function is called (you did not stop inside the function).
Scroll down to line 193. Click with the left mouse in the
source file somewhere in the word build_icosahedron.
Select the PC->Continue To option. This runs the
program until the line with the text cursor. The jello
window will appear. Place it somewhere convenient.
Hit the Step Into button. Notice that you are now in
the build_icosahedron function.
Move the source scroll bar up and down. Notice that there are colored bars in the trough. The green bar represents where the program is currently stopped. The red bar indicates where breakpoints are set.
Use the Step Into button again to step into the new_atom
function. Step through this a couple of times. Hit the Return
button to finish executing the new_atom function and
to return back to build_icosahedron.
Practice using Step Into, Step Over, and PC->Continue To through the rest of this function. When you're tired of this function, hit the Continue button to continue with the program.
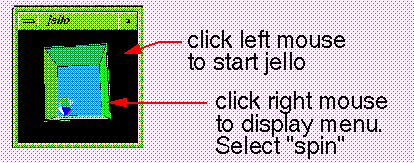
In the application window, click the left mouse button on the object inside the cube to make it bounce. Use the right mouse to select spin from the menu to make it spin.
Leave jello running.
Type CTRL-S. Enter the name spin
Click on Apply. Notice that the source window changes to show the first occurence of "spin". The scroll bar shows yellow highlights to indicate other occurences of the word. Hit the Next button to see the next occurence.
Find line 357, the call to the function spin.
Click in the left margin to enter a breakpoint. The program stops
the next time it calls spin. Click on Continue
a few times.
Click on Step Into to enter the spin
function.
Scroll down to Line 429.
Highlight the expression: -view[1][1]/view[0][1]
Select Views->Expression View from the menus.
Paste the expression into the Expression evaluator. Use the left mouse button to select an expression field. Then use the middle mouse button to paste into the field.
Click on continue a few times and watch the value change
The Structure Browser and Array Browser allow you to see structured data.
Select Views->Structure Browser
In the Expression: field, type in jello_conec and hit return
Maximize Structure Browser window. Double-click the
pointer value in the next field of jello_conec
to bring up another structure. You can continue down the linked
list...
To have the pointers dereference automatically, select the appropriate option in the Config->Preferences window. Now double-click on a next field again. When the dereference limit is hit, you can stop, continue on until the limit is hit again, or continue for every pointer (NOT RECOMMENDED FOR THIS EXAMPLE!!).
Explore the pull-down menus.
Select Views->Array Browser
In the field Array: enter values
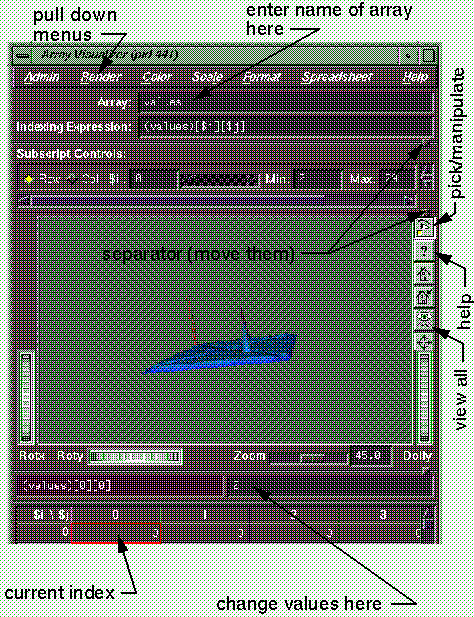
This shows the array as a spreadsheet. You can pick which index is shown in which direction.
You can also render the array as a 3-D surface, with the height controlled by the value of the array element.
Select Render->Surface
Select Color->Exception
Important!
Move the two separators on the right hand side to view the Exception control panel and the third separator to increase the rendering area.
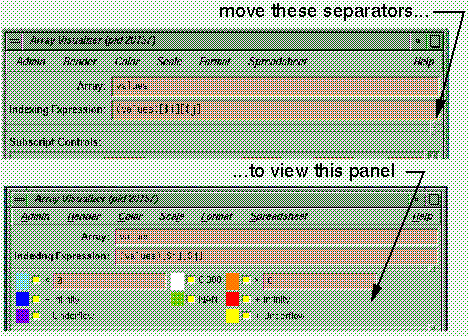
In the Exception control panel change the less than value to 60 and the greater than value to 90.
Rotate image so that the spike is easier to see.
Go into "pick" mode (click on eye icon), click on spike.
Change the value. Try changing some other values. Explore Inventor controls (see next page).
Remove the breakpoint at spin by clicking in the
left column of the source view on the line with the breakpoint.
Select Views->Process Meter.
Select interesting items from the Charts menu.
Hit Continue. The process meter charts are updated as the program runs.
Select Views->Trap Manager. Toggle the breakpoint
in spin off. Hit Continue. Now toggle the
breakpoint back on. The program stops at spin.
Now select Display->Delete all. All of the breakpoints will be cleared.
In the Trap: text field, enter stop in spin.
Enter 50 in the Cycle Count: field. Hit the Continue
button. The program will stop after spin has been
called 50 times.
Clear the Cycle Count: field by entering 1.
Now set a conditional breakpoint by typing
-view[1][1]/view[0][1] <0
in the Condition: field. Hit the Continue button. When the program stops, verify the result in the Expression View window.
Now we're going to find and fix an actual bug.
First, get the appliaction running again.
Click Kill to kill the
current jello. Click Run
to get a new one running.
Remove any break points by clicking in the margin when the program stops.
Now, trigger the bug.
In the jello application window, use the right mouse button to select:
Select Display -> Gouraud
Note that jello now core dumps with a segmentation
violation or bus error, dereferencing bad pointer triangle
(as shown in the debugger main view).
Select (double-click) the word triangle in the source.
Hit CTRL-V.
This shows the value of triangle
(should be 0xbad, which is not
a valid pointer). Note that triangle
is a passed argument. Who passes it?
Select Views->Call Stack
Double click on draw_floor
Note that surface_triangles
is the bad pointer passed as a parameter. So, who set this bad
value? Use static analyzer to
find it:
Select Admin->Launch Tool->Static Analyzer
As a digression, let's explore the Static Analyzer briefly. In the Static Analyzer window:
Select Queries->Functions->List all Functions
Select Views->Call Tree
Maximize the window size
Explore. Double click on a module.
Now back to problem at hand. Who corrupts surface_triangles?
Select Views->Text
Enter surface_triangles
in the Query Target area (or
double click on surface_triangles
in the source)
Select Queries->Variables->Who Sets?
Note that there are three places where surface_triangles
is set. Two of the settings are to NULL,
so they are not the culprits.
The last one sets it to the value of a variable triangle.
Now, you could set a breakpoint here and examine every
value of triangle, but you
will find that the real culprit is elsewhere. Some other part of
the program, through a wild pointer, is overwriting memory and
corrupting the value of surface_triangles.
To find this, we'll use a feature of the debugger called "Fast Data Watchpoints".
Debuggers like dbx implement data watchpoints (stop when variable is changed) by single-stepping the program and checking for new values of the memory location.
This is painfully slow (maybe 100-1000 times slower).
CASEVision/WorkShop uses the virtual memory system of IRIX to watch the memory location instead. This means that the program runs at full speed except when it accesses the page containing the data being watched.
We're going to start the program again, stop it, and set a watchpoint.
Click on Run
Click on Stop
Select View->Trap Manager
Enter watch surface_triangles in the Trap: field, and press < Return > on the keyboard.
Note that an entry appears in the bottom panel for this watchpoint, with a toggle to the left of it. You can use this toggle to activate and de-activate the watchpoint, to see its impact on program speed.
Click on Continue
Now click the toggle in the Trap Manager on and off
to see that there is no perceptible slowdown in the execution
speed of jello.
Now trigger the bug again. In the application window:
Display->Gouraud (right mouse button)
The watchpoint now fires, and the program is stopped at the
point where a dangling pointer overwrites the value of surface_triangles.
Verify:
Views->Expression View
Enter dangling_pointer
Enter &surface_triangles
Note that both point to the same memory location.
First, check the file out of the version control system.
CASEVision/WorkShop uses ToolTalk to integrate with your choice of version control systems (RCS, SCCS, CASEVision/ClearCase).
For this demonstration, we use RCS, and the CASEVIsion/WorkShop encapsulation that allows RCS to respond to ToolTalk messages. In the debugger main view:
Source->Versioning->Checkout
Source->Make Editable
Delete the line with the dangling_pointer setting (triple-click to select the line, then hit Delete on the keyboard).
Save the file.
Source->Save (Answer yes to any dialog boxes about saving files.)
Now recompile the file.
Source->Recompile
Note that the build manager compiles and automatically attaches the new executable to the debugger. Verify that the bug has been fixed:
Click on Run
In the application window:
Display->Gouraud
Congratulations! You are now an accomplished software developer!