Yves Darly Jean

For more detailed information, please see my resume.
Background
Yves Jean is a PhD student in the
Graphics, Visualization, and Usability Center
of the College of Computing
at the
Georgia Institute of Technology
.
He received a B.S. in Electrical Engineering from Columbia University in
1988 and a M.S. in Information and Computer Science from
Georgia Tech in 1991.
Research
His research interests include developing efficient Volume Rendering
algorithms (dissertation topic), Real-time Interactive Visualization, Medical Imaging, and Digital
Signal Processing (Compression).
Spectree volume rendering results
Research Projects
|
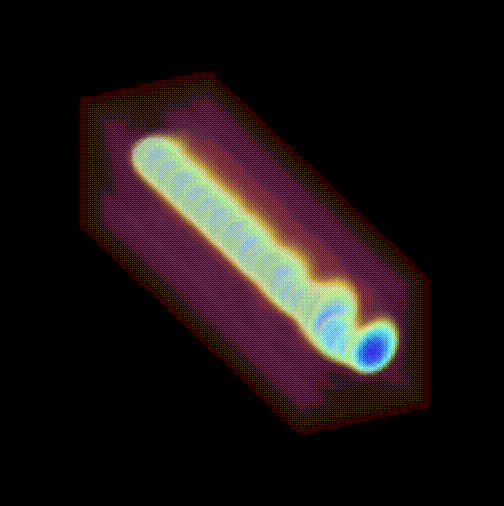
Yves' dissertation topic is Accelerated Rendering of Large Datasets via Spatial/Spectral Analysis. An algorithm has been developed which reduces the rendering computational complexity of volume rendering by using a spatial/spectral decomposition and analysis similar to Wavelets. The technique is controlled for accuracy by the user using one parameter. Pictured to the left is a amospheric model simulation volume rendered in 1/3 the time of normal volume rendering. (Data courtesy of Gordon Watson, UK Universities Global Atmospheric modelling programme) |
|
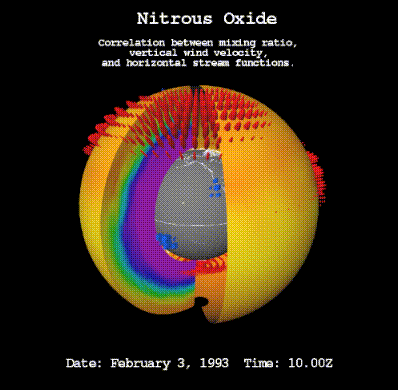
Yves is currently funded by the NASA project: Parallelization & Visual Analysis of Dynamical/Chemical Atmospheric Models (IEEE Visualization 95). Pictured on the left is a visualization of the earth's atmosphere. Nitrous oxide, vertical wind fields, and the stream function are represented by textured surfaces, red sphere and blue cuboid glyphs, respectively. The current phase of the project is to graphically steer the computational model. Two movies are avaialable. |

|
Yves previously worked on a research project with radiologists from Emory University School of Medicine resulting in the installation of a SGI workstation to evaluate the software he developed and paper: A Method for Interactive Manipulation and Animation of Volumetric Data (Visualization in Biomedical Computing 1992). To the left is a picture of a patient's cardiac MRI scan data. A reference plane shows the general location of the cardiac muscle, a red highlight represents regions of suspected abnormality. |
E-mail:
yves@cc.gatech.edu