This video shows our tracker in action on 3 different datasets: Laser-based basketball data, video-based fish data, and video-based ant data.
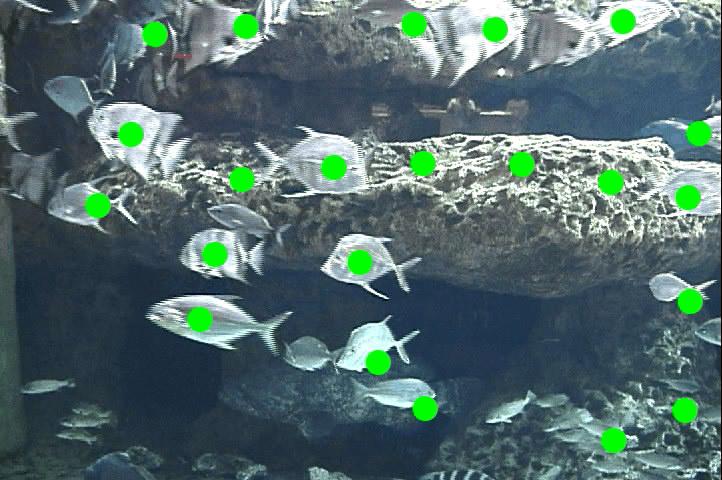
Automatically Tracking Fish
Basketball Games
On June 22, 2006, we tracked two 4-on-4 basketball games. These videos are from the first game that day. Each shows subsequent stages in processing, from (almost) raw data to full generated tracks. Note that one of the lasers was knocked over at around 18 minutes into the game. It is clear to see the effects of this as the laser was reset. Also, for the rest of game, the laser is noticably not aligned, yet the tracker still does well.
 (click the picture for a clip) |
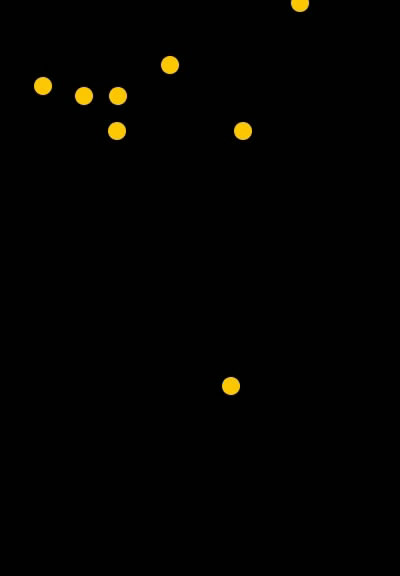
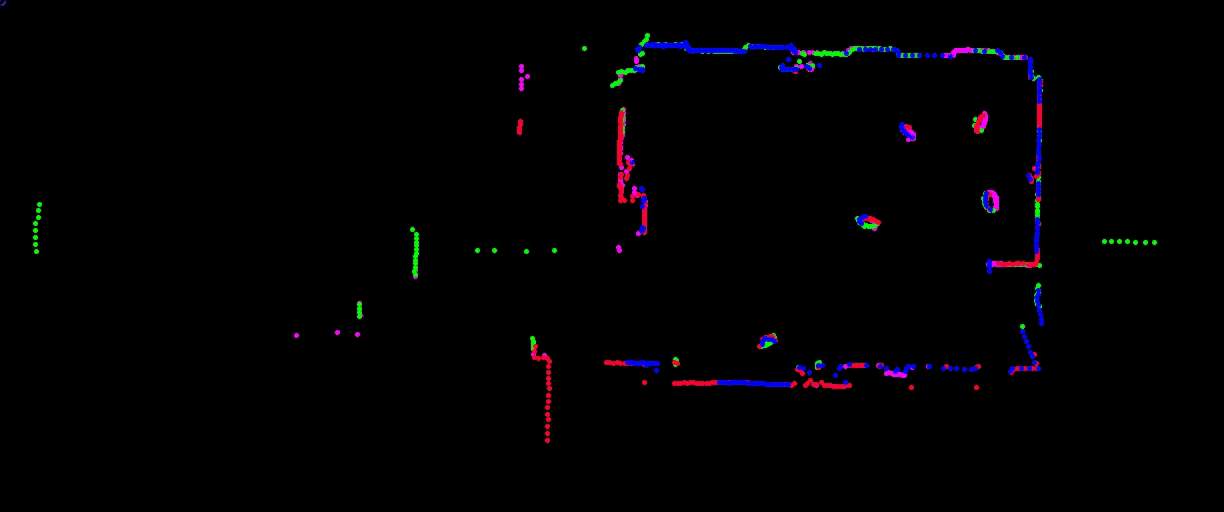
In this video, the raw data has been spatially and temporally registered. The dots are color coded based on which laser generated the hit, while the large circles represent the lasers. The large room contains two courts; our game was on the left court. |
 (click the picture for a clip or here for the full game) |
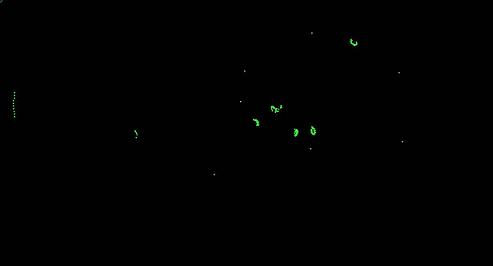
The data from the previous video was run through our background subtractor to remove all data not related to the 8 players. This is the data that is going to go to the tracker for tracking. | ||
 (click the picture for a clip or here for the full game) |
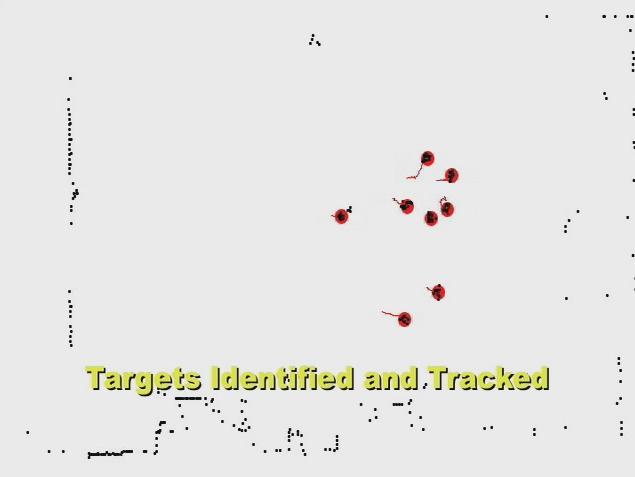
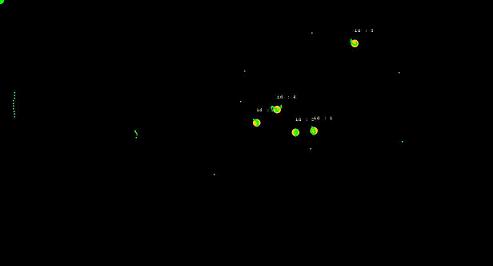
This video shows the tracks that were generated by our tracker from the above data. |
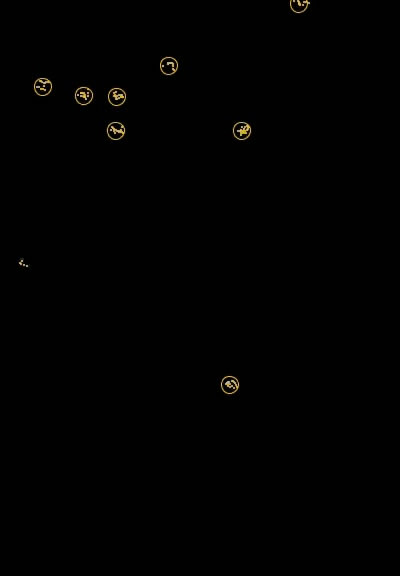 (click the picture for a clip or here for the full game) |
In this video you can see the original background subtracted data (small dots) with the tracks (larger open circles) overlayed, to show the effectiveness of the tracker. |
Switching Linear Dynamic System (SLDS) for Honey Bee Dance Segmentation
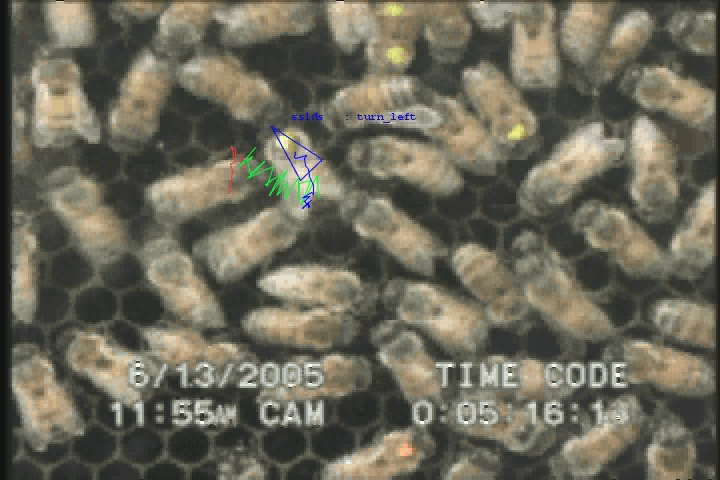
500 meter dance(20 MB) 50 meter dance(20 MB)
An SLDS is an intuitive model to describe the nonlinear dynamics using a set of switching linear dynamic systems (LDSs).
Automatically Identifying Social Behavior
mov (7.1MB)
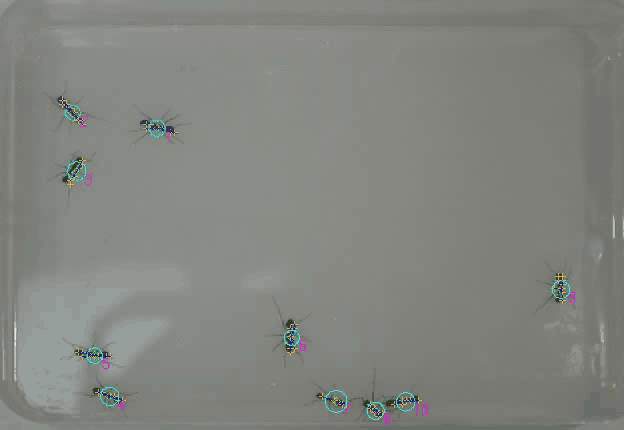
Members of a Leptothorax colony explore a new nest at the beginning of a migration. As they explore the new nest, they have interactions with one another that influence their migration behavior. In this video, the ants are tracked and interactions are automatically labeled by our software.
Tracking People
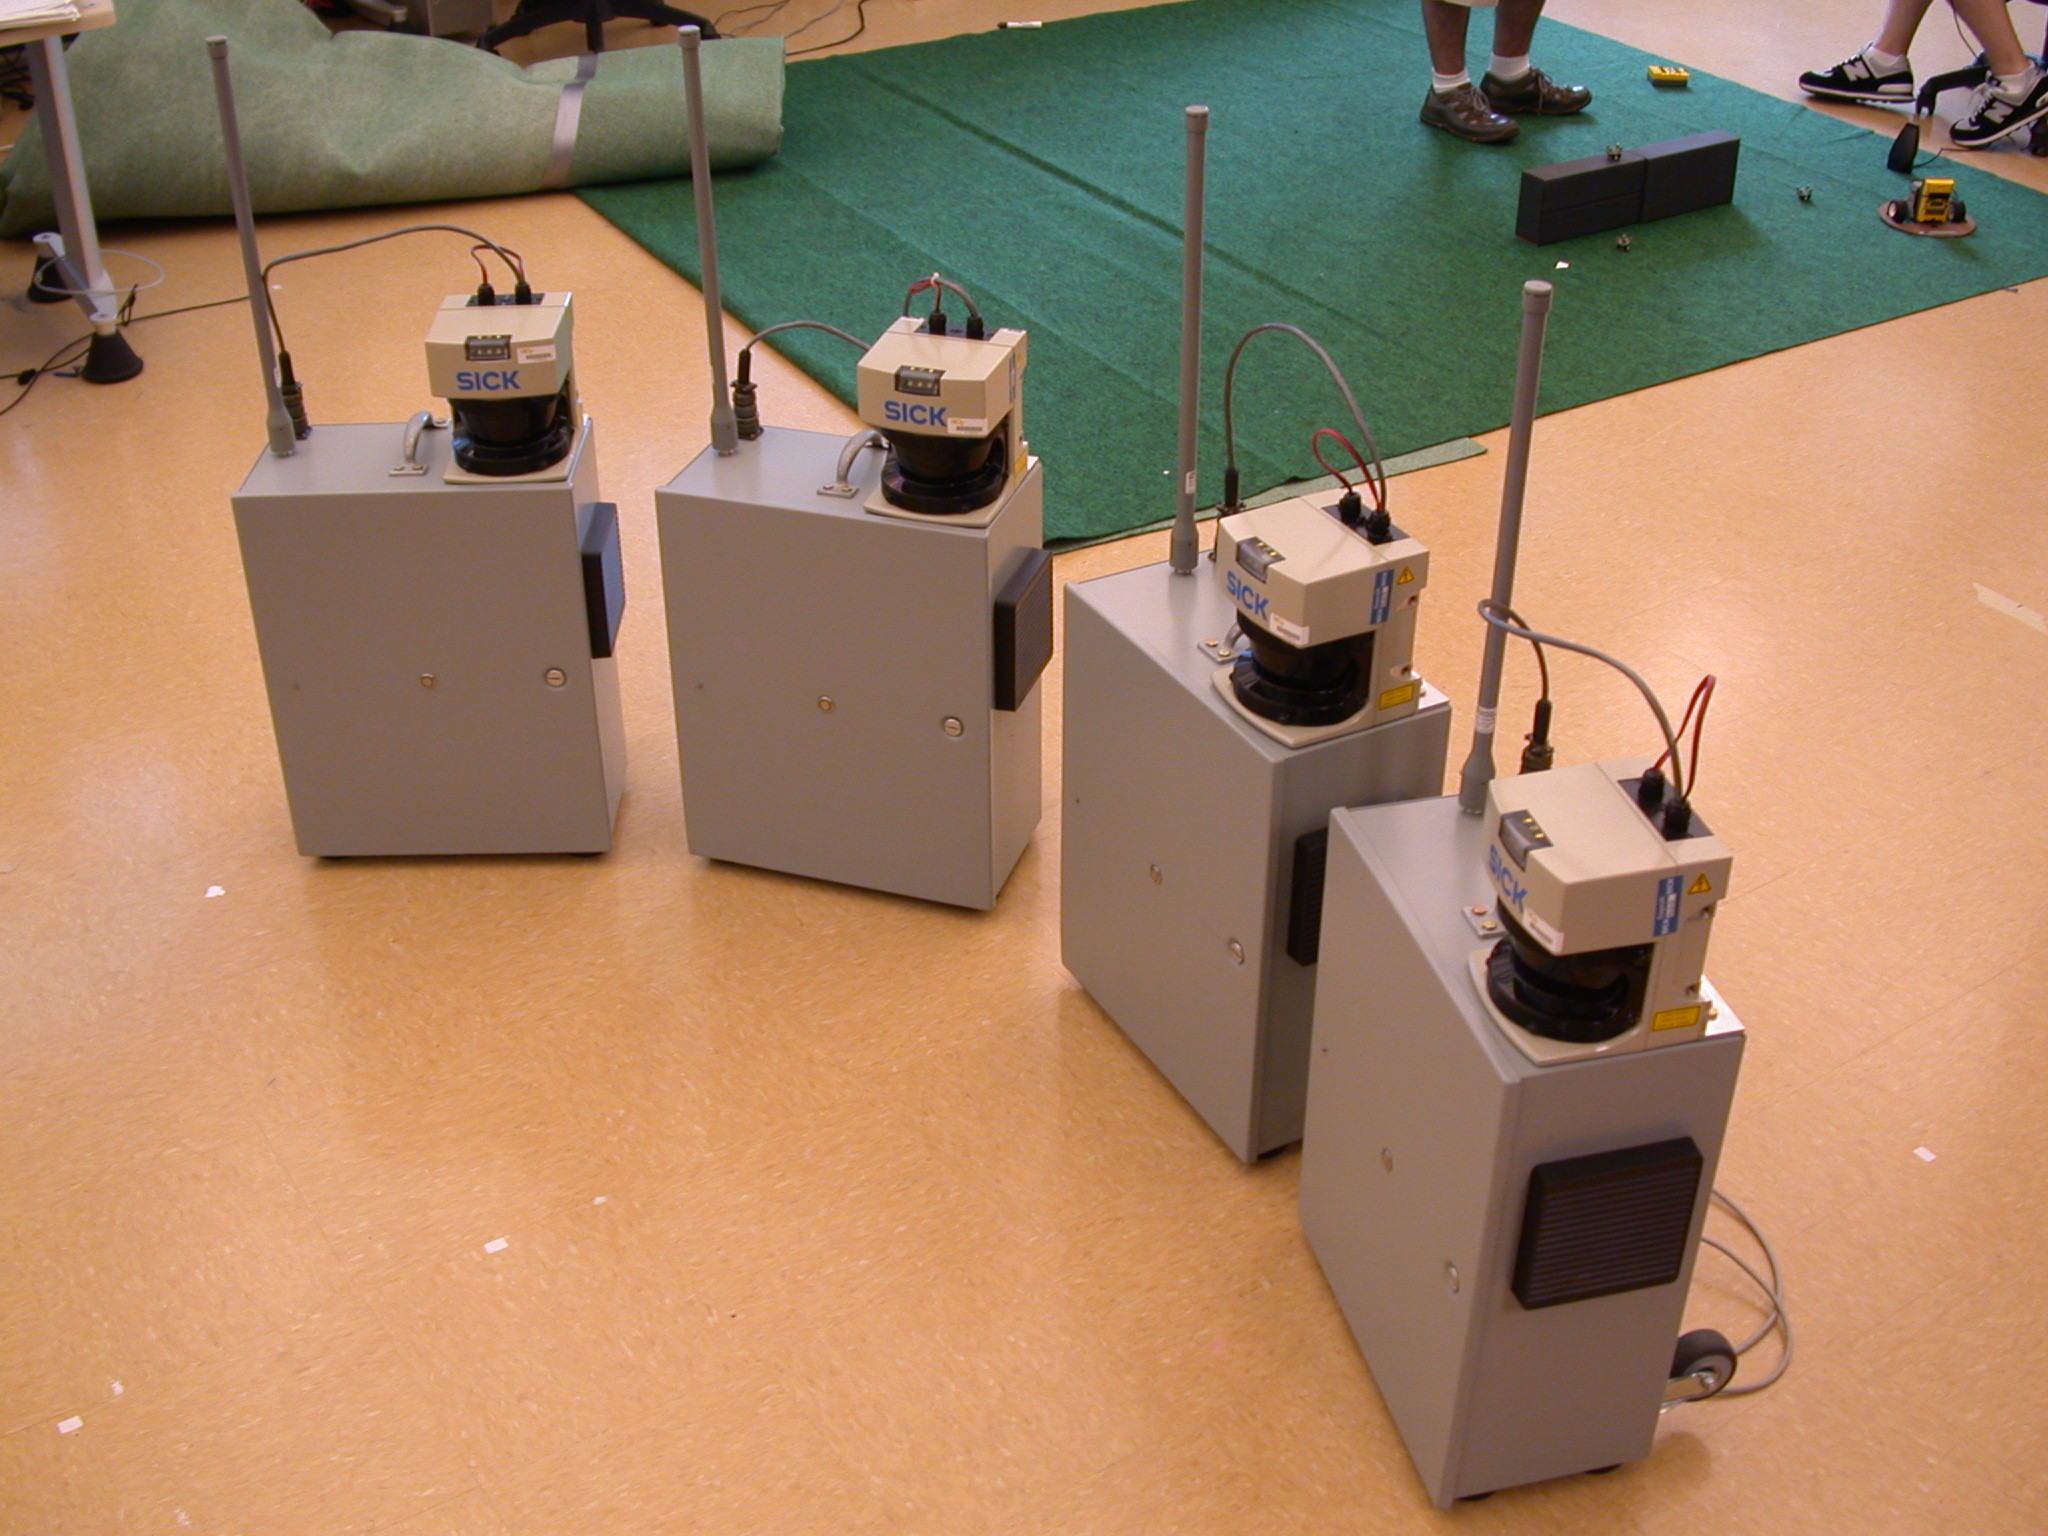
These four SICK laser scanners were used to generate the below videos.
avi (3.4MB)
 mpg (6.7MB)
 mpg (6.7MB)
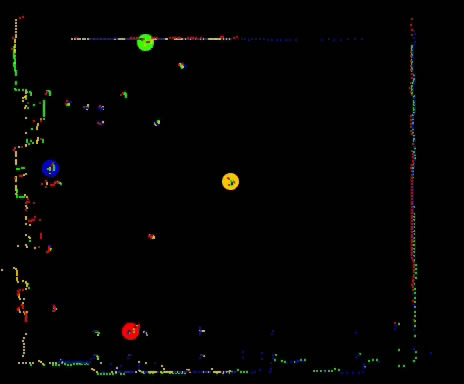
The above videos show 5 people walking around the lab, their motions being captured by four SICK laser scanners (each represented by a different color), which have been registered in space and time. The dimensions of the area in the movie are about 100 feet by 50 feet. The first video is an example of a compilation of what the 4 lasers "see", while the second has had the background subtracted, leaving only the moving elements. The final video has the generated tracks super-imposed on the raw laser points.
Tracking Multiple Ants Simultaneously
avi (9MB)
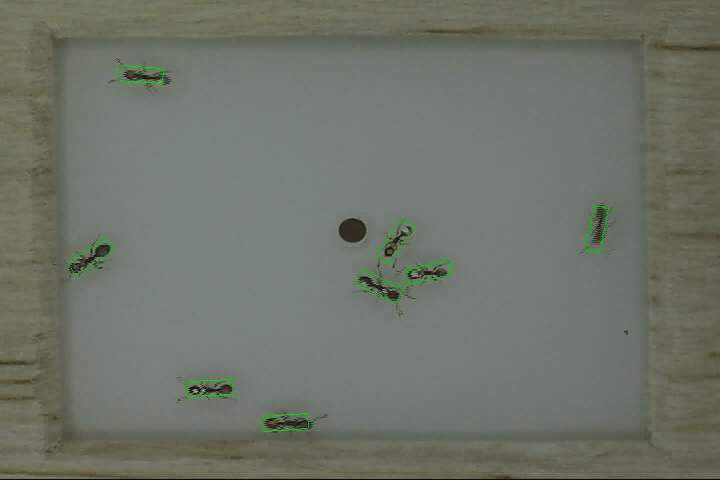
In this video multiple ants can leave and enter a habitat at will through a hole in the center. Our software is able to track them once they enter, and drop tracks when they leave. The green boxes indicate where our software estimates the ants are.
mpg (3.4MB)
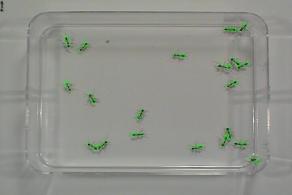
Multiple ants are tracked using a particle filter based tracking method. We implement a Markov random field based motion model to prevent tracker switches during interactions. Click on the above image to view the sample video.
avi (3.5MB) or mov (8.1MB)
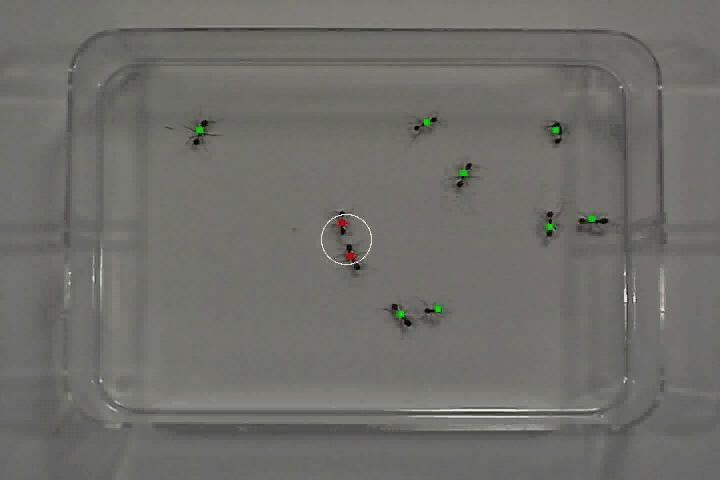
From the collected trajectories, interactions can be recognized based on a model of an ant's sensory field. Click on the above image to view the sample video.
mpg (5.1MB)
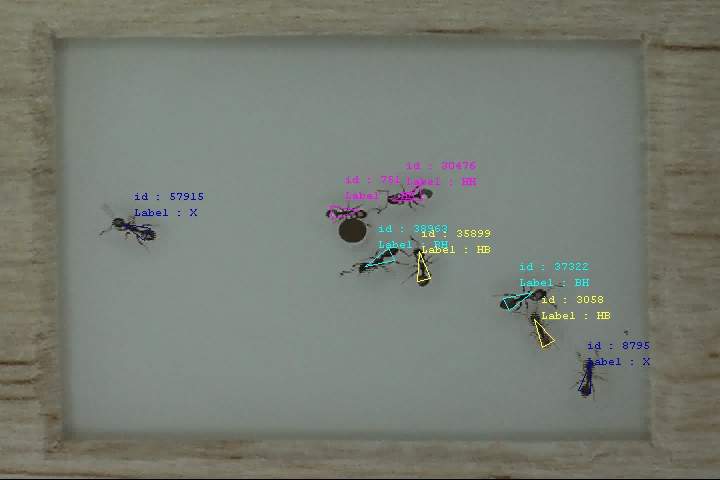
Interactions can be classified into different types by modeling the sensory fields of the antennae and the body of the ant.
avi (20.0MB)
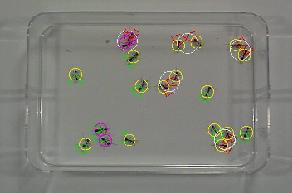
Interactions are detected among tracked ants.
Automatically Identifying a Dancing Bee
avi (3.4MB)
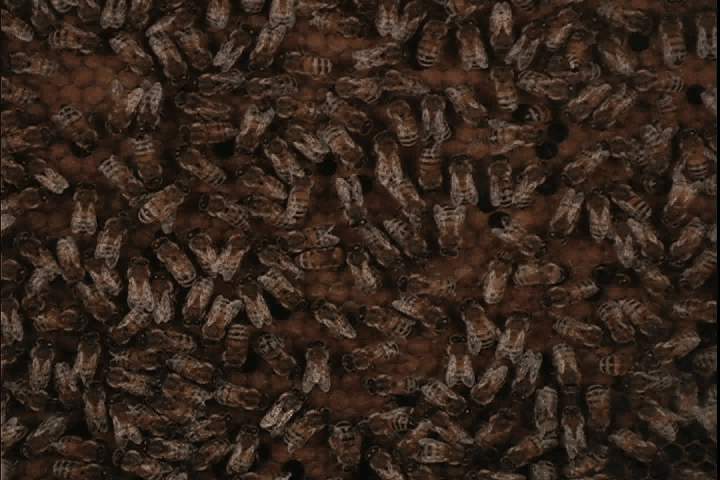
Raw bee footage from our observation hive which will be used by tracking software.
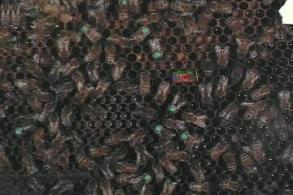
Several marked bees are tracked simultaneously to collect data on their movements. We are also developing techniques to track unmarked bees.
mpg (7.2MB)
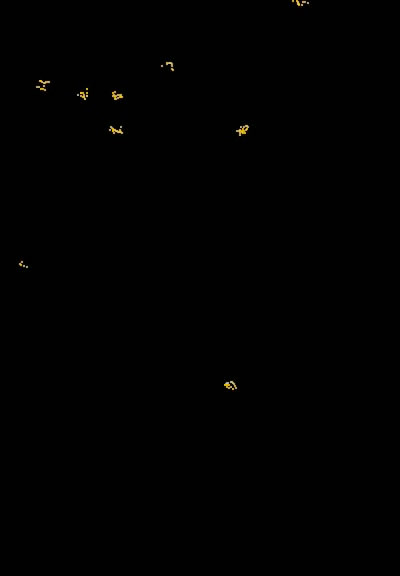
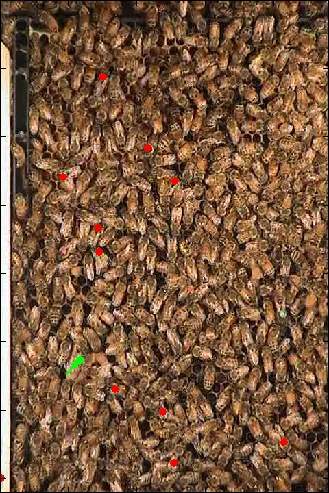
Marked bees can be tracked in an observation hive on a comb with hundreds of bees (red dots). Dancing foragers are automatically identified (green dot).
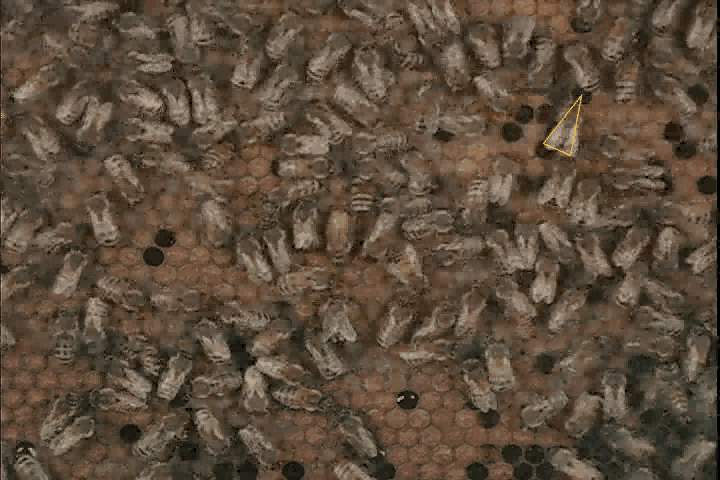
avi (7.1MB)
An unmarked bee being tracked as it performs a waggle dance.
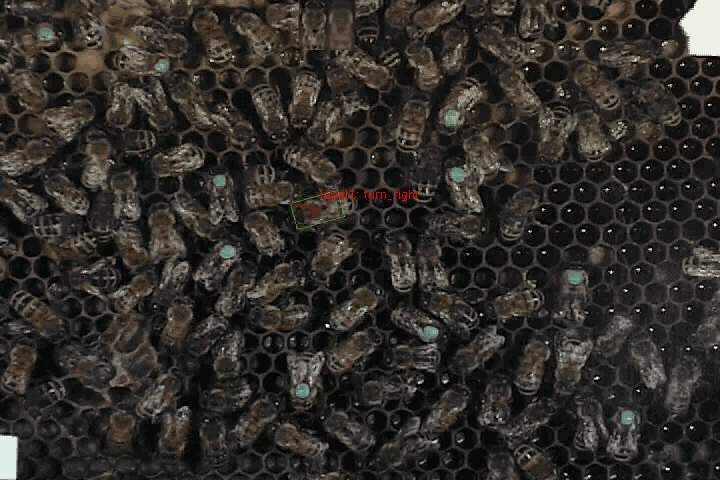
avi (38MB)
An unmarked, tracked bee automatically labelled using MCMC as it performs a waggle dance.