Acknowledgements
Work undertaken at The Numerical Algorithms Group Ltd (NAG)
Oxford, UK by
Astrid van Maanen,
Peter Keating and
Jeremy Walton.
NAGgraph
- Displays y(x) as line/marker plot
- Axes labels, annotation, legend
- Optional PostScript output
- Support for multiple data variables
- Choice of interpolation methods
- Hershey fonts used for labelling
- Support for in-string keywords
- e.g !gG!d0n -> G0
Ruler
- Samples data from 2D or 3D lattice
- Lookup points arranged in straight line
- User specifies first and last point, either
- by picking in the display window
- by using widgets
- Outputs
- interpolated lattice
- geometry of line and endpoints
Examples
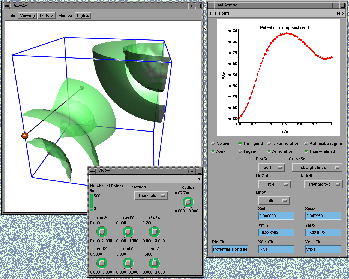
Atomic potential energy

- Three interacting atoms in box
- Potential is 3D lattice
- Isosurface for small -ve potential
- User selects endpoints via dials
- Ruler interpolates potential along path
- outputs 1D lattice to NAGgraph
- outputs geometry to Render
- PostScript output from NAGgraph (example)
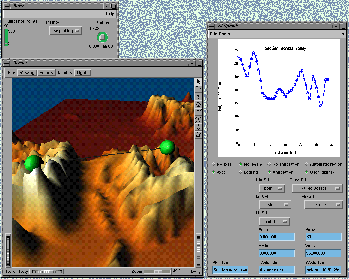
Digital topography

- Height field obtained from satellite data
- Height is 2D lattice
- Displayed using LatToGeom
- User picks endpoints in Render
- Ruler interpolates heights along path
- outputs 1D lattice to NAGgraph
- outputs geometry to Render
- PostScript output from NAGgraph
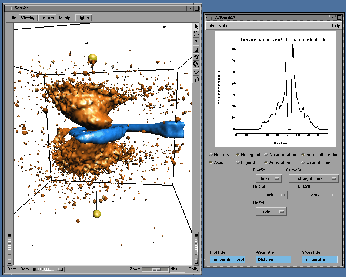
Computational hydrodynamics

- Simulation of binary star
- Leaking gases form accretion disk
- Density and temperature are 3D lattices
- density displayed as blue isosurface
- temperature as orange isosurface
- Shows high-T jet normal to disk
- Ruler used to show T profile along jet
Data courtesy of Drew Whitehouse & Gustav Meglicki, ANU
Supercomputer Facility
Last modified: Mon Aug 5 14:50:19 1996
[ Posters Home ]
© The Numerical Algorithms Group Ltd, Oxford UK, 1996.


