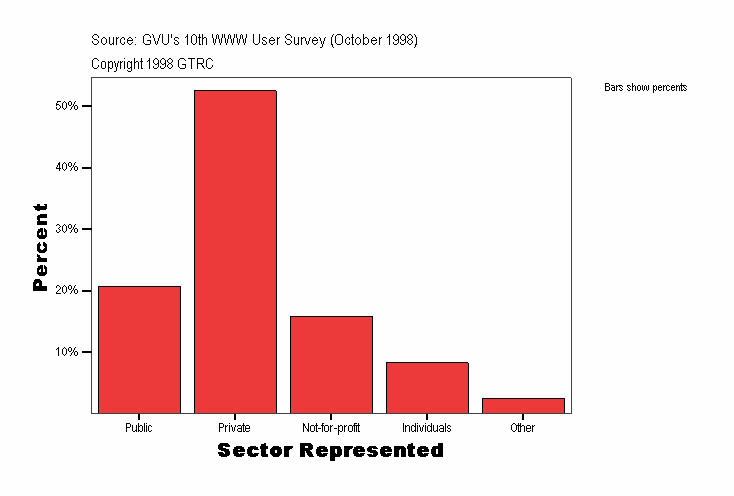
Sector Represented
|
Frequency |
Percent |
Valid Percent |
Cumulative Percent |
|---|
| Valid |
Public |
90
| 20.7
| 20.7
| 20.7
|
|---|
| Private |
228
| 52.5
| 52.5
| 73.3
|
|---|
| Not-for-profit |
69
| 15.9
| 15.9
| 89.2
|
|---|
| Individuals |
36
| 8.3
| 8.3
| 97.5
|
|---|
| Other |
11
| 2.5
| 2.5
| 100.0
|
|---|
| Total |
434
| 100.0
| 100.0
|
|
|---|
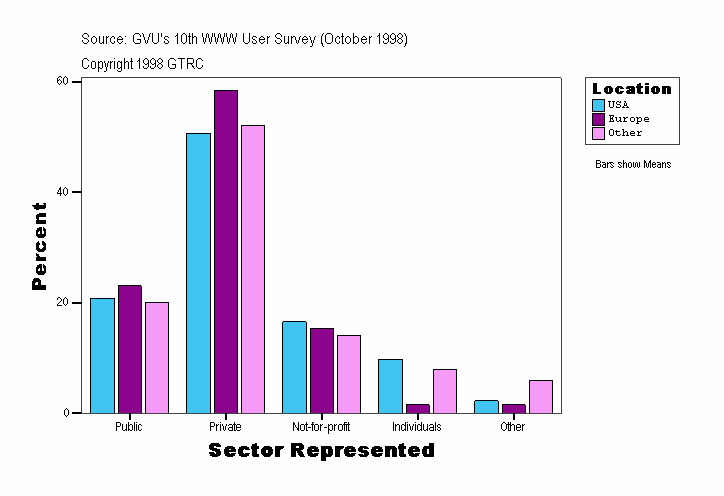
Sector Represented
| Location |
Frequency |
Percent |
Valid Percent |
Cumulative Percent |
|---|
| . |
Valid |
Public |
1
| 9.1
| 9.1
| 9.1
|
|---|
| Private |
8
| 72.7
| 72.7
| 81.8
|
|---|
| Not-for-profit |
1
| 9.1
| 9.1
| 90.9
|
|---|
| Individuals |
1
| 9.1
| 9.1
| 100.0
|
|---|
| Total |
11
| 100.0
| 100.0
|
|
|---|
| USA |
Valid |
Public |
64
| 20.8
| 20.8
| 20.8
|
|---|
| Private |
156
| 50.6
| 50.6
| 71.4
|
|---|
| Not-for-profit |
51
| 16.6
| 16.6
| 88.0
|
|---|
| Individuals |
30
| 9.7
| 9.7
| 97.7
|
|---|
| Other |
7
| 2.3
| 2.3
| 100.0
|
|---|
| Total |
308
| 100.0
| 100.0
|
|
|---|
| Europe |
Valid |
Public |
15
| 23.1
| 23.1
| 23.1
|
|---|
| Private |
38
| 58.5
| 58.5
| 81.5
|
|---|
| Not-for-profit |
10
| 15.4
| 15.4
| 96.9
|
|---|
| Individuals |
1
| 1.5
| 1.5
| 98.5
|
|---|
| Other |
1
| 1.5
| 1.5
| 100.0
|
|---|
| Total |
65
| 100.0
| 100.0
|
|
|---|
| Other |
Valid |
Public |
10
| 20.0
| 20.0
| 20.0
|
|---|
| Private |
26
| 52.0
| 52.0
| 72.0
|
|---|
| Not-for-profit |
7
| 14.0
| 14.0
| 86.0
|
|---|
| Individuals |
4
| 8.0
| 8.0
| 94.0
|
|---|
| Other |
3
| 6.0
| 6.0
| 100.0
|
|---|
| Total |
50
| 100.0
| 100.0
|
|
|---|
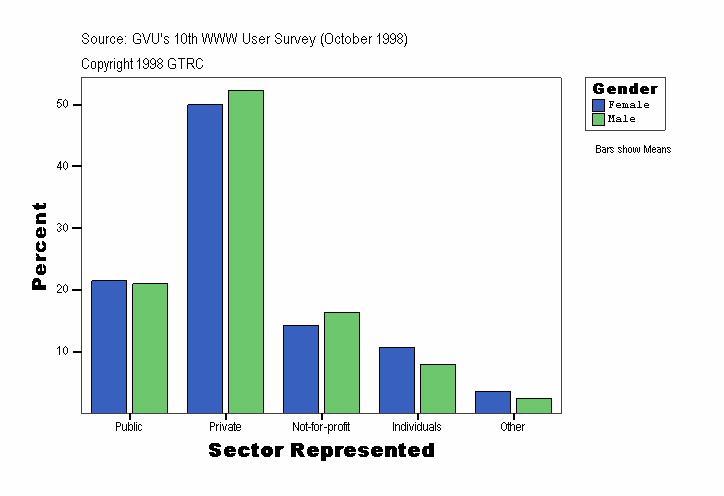
Sector Represented
| Gender |
Frequency |
Percent |
Valid Percent |
Cumulative Percent |
|---|
| . |
Valid |
Public |
1
| 9.1
| 9.1
| 9.1
|
|---|
| Private |
8
| 72.7
| 72.7
| 81.8
|
|---|
| Not-for-profit |
1
| 9.1
| 9.1
| 90.9
|
|---|
| Individuals |
1
| 9.1
| 9.1
| 100.0
|
|---|
| Total |
11
| 100.0
| 100.0
|
|
|---|
| Female |
Valid |
Public |
12
| 21.4
| 21.4
| 21.4
|
|---|
| Private |
28
| 50.0
| 50.0
| 71.4
|
|---|
| Not-for-profit |
8
| 14.3
| 14.3
| 85.7
|
|---|
| Individuals |
6
| 10.7
| 10.7
| 96.4
|
|---|
| Other |
2
| 3.6
| 3.6
| 100.0
|
|---|
| Total |
56
| 100.0
| 100.0
|
|
|---|
| Male |
Valid |
Public |
77
| 21.0
| 21.0
| 21.0
|
|---|
| Private |
192
| 52.3
| 52.3
| 73.3
|
|---|
| Not-for-profit |
60
| 16.3
| 16.3
| 89.6
|
|---|
| Individuals |
29
| 7.9
| 7.9
| 97.5
|
|---|
| Other |
9
| 2.5
| 2.5
| 100.0
|
|---|
| Total |
367
| 100.0
| 100.0
|
|
|---|
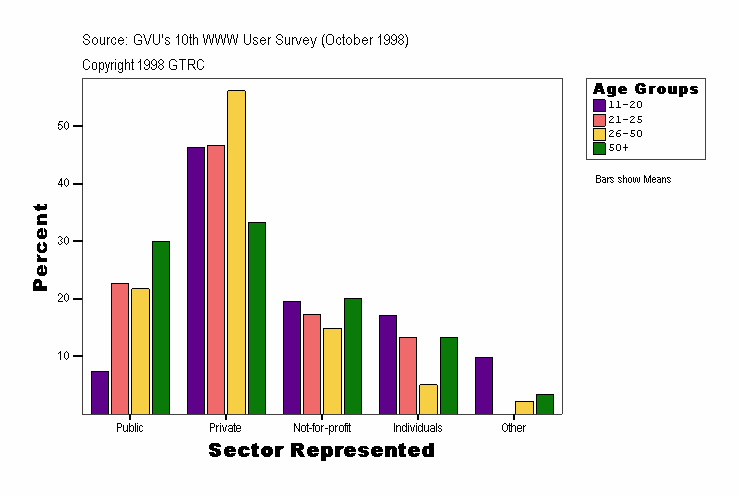
Sector Represented
| Age Groups |
Frequency |
Percent |
Valid Percent |
Cumulative Percent |
|---|
| . |
Valid |
Public |
1
| 8.3
| 8.3
| 8.3
|
|---|
| Private |
9
| 75.0
| 75.0
| 83.3
|
|---|
| Not-for-profit |
1
| 8.3
| 8.3
| 91.7
|
|---|
| Individuals |
1
| 8.3
| 8.3
| 100.0
|
|---|
| Total |
12
| 100.0
| 100.0
|
|
|---|
| 11-20 |
Valid |
Public |
3
| 7.3
| 7.3
| 7.3
|
|---|
| Private |
19
| 46.3
| 46.3
| 53.7
|
|---|
| Not-for-profit |
8
| 19.5
| 19.5
| 73.2
|
|---|
| Individuals |
7
| 17.1
| 17.1
| 90.2
|
|---|
| Other |
4
| 9.8
| 9.8
| 100.0
|
|---|
| Total |
41
| 100.0
| 100.0
|
|
|---|
| 21-25 |
Valid |
Public |
17
| 22.7
| 22.7
| 22.7
|
|---|
| Private |
35
| 46.7
| 46.7
| 69.3
|
|---|
| Not-for-profit |
13
| 17.3
| 17.3
| 86.7
|
|---|
| Individuals |
10
| 13.3
| 13.3
| 100.0
|
|---|
| Total |
75
| 100.0
| 100.0
|
|
|---|
| 26-50 |
Valid |
Public |
60
| 21.7
| 21.7
| 21.7
|
|---|
| Private |
155
| 56.2
| 56.2
| 77.9
|
|---|
| Not-for-profit |
41
| 14.9
| 14.9
| 92.8
|
|---|
| Individuals |
14
| 5.1
| 5.1
| 97.8
|
|---|
| Other |
6
| 2.2
| 2.2
| 100.0
|
|---|
| Total |
276
| 100.0
| 100.0
|
|
|---|
| 50+ |
Valid |
Public |
9
| 30.0
| 30.0
| 30.0
|
|---|
| Private |
10
| 33.3
| 33.3
| 63.3
|
|---|
| Not-for-profit |
6
| 20.0
| 20.0
| 83.3
|
|---|
| Individuals |
4
| 13.3
| 13.3
| 96.7
|
|---|
| Other |
1
| 3.3
| 3.3
| 100.0
|
|---|
| Total |
30
| 100.0
| 100.0
|
|
|---|
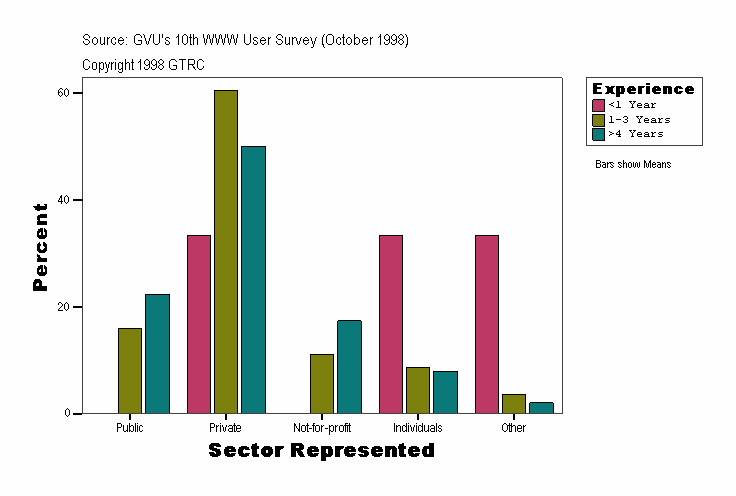
Sector Represented
| Experience |
Frequency |
Percent |
Valid Percent |
Cumulative Percent |
|---|
| . |
Valid |
Public |
1
| 9.1
| 9.1
| 9.1
|
|---|
| Private |
8
| 72.7
| 72.7
| 81.8
|
|---|
| Not-for-profit |
1
| 9.1
| 9.1
| 90.9
|
|---|
| Individuals |
1
| 9.1
| 9.1
| 100.0
|
|---|
| Total |
11
| 100.0
| 100.0
|
|
|---|
| <1 Year |
Valid |
Private |
1
| 33.3
| 33.3
| 33.3
|
|---|
| Individuals |
1
| 33.3
| 33.3
| 66.7
|
|---|
| Other |
1
| 33.3
| 33.3
| 100.0
|
|---|
| Total |
3
| 100.0
| 100.0
|
|
|---|
| 1-3 Years |
Valid |
Public |
13
| 16.0
| 16.0
| 16.0
|
|---|
| Private |
49
| 60.5
| 60.5
| 76.5
|
|---|
| Not-for-profit |
9
| 11.1
| 11.1
| 87.7
|
|---|
| Individuals |
7
| 8.6
| 8.6
| 96.3
|
|---|
| Other |
3
| 3.7
| 3.7
| 100.0
|
|---|
| Total |
81
| 100.0
| 100.0
|
|
|---|
| >4 Years |
Valid |
Public |
76
| 22.4
| 22.4
| 22.4
|
|---|
| Private |
170
| 50.1
| 50.1
| 72.6
|
|---|
| Not-for-profit |
59
| 17.4
| 17.4
| 90.0
|
|---|
| Individuals |
27
| 8.0
| 8.0
| 97.9
|
|---|
| Other |
7
| 2.1
| 2.1
| 100.0
|
|---|
| Total |
339
| 100.0
| 100.0
|
|
|---|
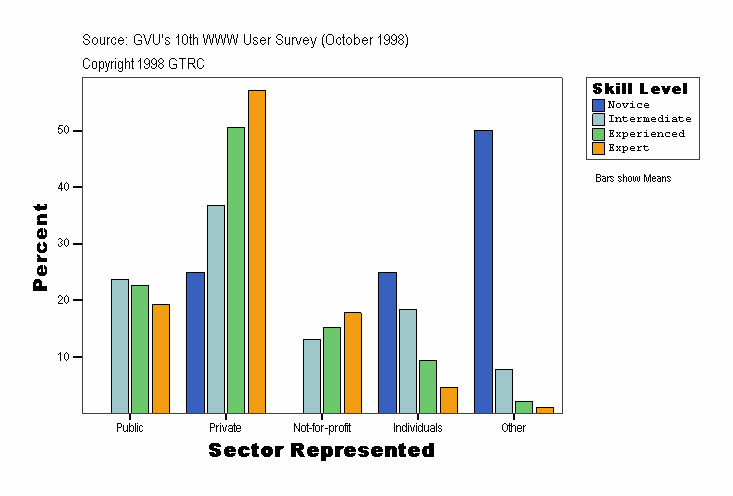
Sector Represented
| Skill Level |
Frequency |
Percent |
Valid Percent |
Cumulative Percent |
|---|
| . |
Valid |
Public |
1
| 9.1
| 9.1
| 9.1
|
|---|
| Private |
8
| 72.7
| 72.7
| 81.8
|
|---|
| Not-for-profit |
1
| 9.1
| 9.1
| 90.9
|
|---|
| Individuals |
1
| 9.1
| 9.1
| 100.0
|
|---|
| Total |
11
| 100.0
| 100.0
|
|
|---|
| Novice |
Valid |
Private |
1
| 25.0
| 25.0
| 25.0
|
|---|
| Individuals |
1
| 25.0
| 25.0
| 50.0
|
|---|
| Other |
2
| 50.0
| 50.0
| 100.0
|
|---|
| Total |
4
| 100.0
| 100.0
|
|
|---|
| Intermediate |
Valid |
Public |
9
| 23.7
| 23.7
| 23.7
|
|---|
| Private |
14
| 36.8
| 36.8
| 60.5
|
|---|
| Not-for-profit |
5
| 13.2
| 13.2
| 73.7
|
|---|
| Individuals |
7
| 18.4
| 18.4
| 92.1
|
|---|
| Other |
3
| 7.9
| 7.9
| 100.0
|
|---|
| Total |
38
| 100.0
| 100.0
|
|
|---|
| Experienced |
Valid |
Public |
43
| 22.6
| 22.6
| 22.6
|
|---|
| Private |
96
| 50.5
| 50.5
| 73.2
|
|---|
| Not-for-profit |
29
| 15.3
| 15.3
| 88.4
|
|---|
| Individuals |
18
| 9.5
| 9.5
| 97.9
|
|---|
| Other |
4
| 2.1
| 2.1
| 100.0
|
|---|
| Total |
190
| 100.0
| 100.0
|
|
|---|
| Expert |
Valid |
Public |
37
| 19.4
| 19.4
| 19.4
|
|---|
| Private |
109
| 57.1
| 57.1
| 76.4
|
|---|
| Not-for-profit |
34
| 17.8
| 17.8
| 94.2
|
|---|
| Individuals |
9
| 4.7
| 4.7
| 99.0
|
|---|
| Other |
2
| 1.0
| 1.0
| 100.0
|
|---|
| Total |
191
| 100.0
| 100.0
|
|
|---|
Source: GVU's Tenth WWW User Survey (Conducted October 1998)
URL:http://www.gvu.gatech.edu/user_surveys/
Copyright 1998 GTRC - ALL RIGHTS RESERVED
Contact: www-survey@cc.gatech.edu
For more information or to submit comments:
send email to www-survey@cc.gatech.edu.
GVU's WWW Surveying Team
Graphics, Visualization, & Usability Center
College of Computing
Georgia Institute of Technology
Atlanta, GA 30332-0280
