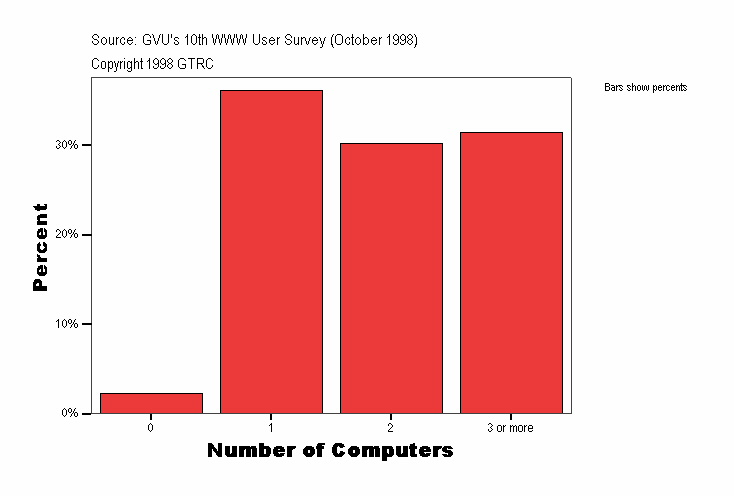
Number of Computers
|
Frequency |
Percent |
Valid Percent |
Cumulative Percent |
|---|
| Valid |
0 |
62
| 2.3
| 2.3
| 2.3
|
|---|
| 1 |
978
| 36.1
| 36.1
| 38.4
|
|---|
| 2 |
818
| 30.2
| 30.2
| 68.6
|
|---|
| 3 or more |
852
| 31.4
| 31.4
| 100.0
|
|---|
| Total |
2710
| 100.0
| 100.0
|
|
|---|
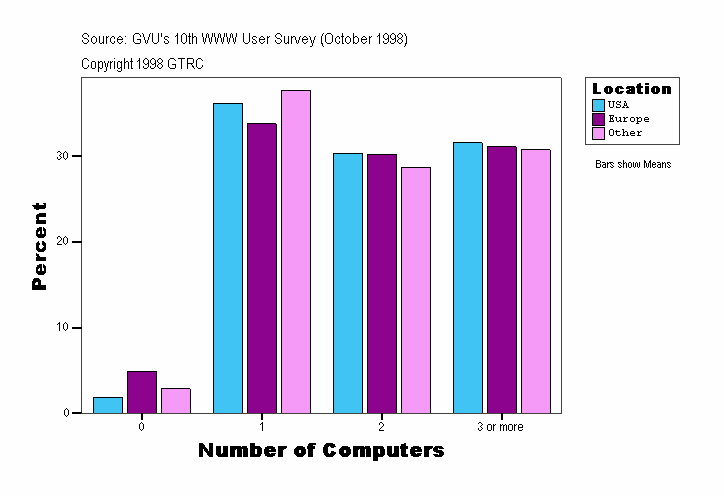
Number of Computers
| Location |
Frequency |
Percent |
Valid Percent |
Cumulative Percent |
|---|
| . |
Valid |
0 |
2
| 5.9
| 5.9
| 5.9
|
|---|
| 1 |
12
| 35.3
| 35.3
| 41.2
|
|---|
| 2 |
10
| 29.4
| 29.4
| 70.6
|
|---|
| 3 or more |
10
| 29.4
| 29.4
| 100.0
|
|---|
| Total |
34
| 100.0
| 100.0
|
|
|---|
| USA |
Valid |
0 |
42
| 1.9
| 1.9
| 1.9
|
|---|
| 1 |
798
| 36.2
| 36.2
| 38.1
|
|---|
| 2 |
670
| 30.4
| 30.4
| 68.4
|
|---|
| 3 or more |
697
| 31.6
| 31.6
| 100.0
|
|---|
| Total |
2207
| 100.0
| 100.0
|
|
|---|
| Europe |
Valid |
0 |
11
| 4.9
| 4.9
| 4.9
|
|---|
| 1 |
76
| 33.8
| 33.8
| 38.7
|
|---|
| 2 |
68
| 30.2
| 30.2
| 68.9
|
|---|
| 3 or more |
70
| 31.1
| 31.1
| 100.0
|
|---|
| Total |
225
| 100.0
| 100.0
|
|
|---|
| Other |
Valid |
0 |
7
| 2.9
| 2.9
| 2.9
|
|---|
| 1 |
92
| 37.7
| 37.7
| 40.6
|
|---|
| 2 |
70
| 28.7
| 28.7
| 69.3
|
|---|
| 3 or more |
75
| 30.7
| 30.7
| 100.0
|
|---|
| Total |
244
| 100.0
| 100.0
|
|
|---|
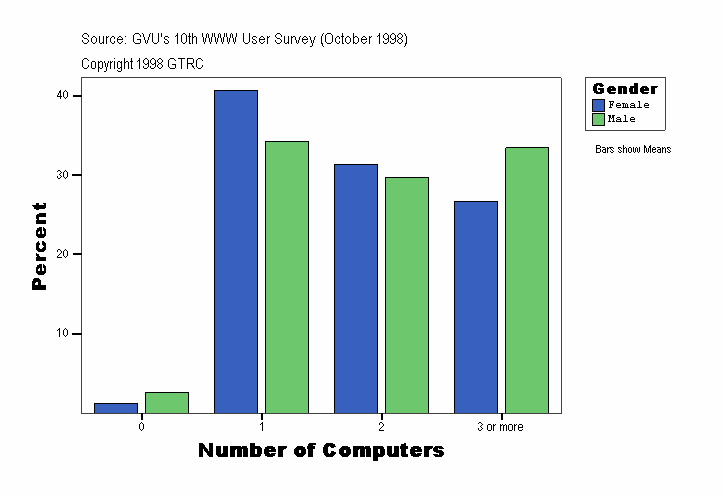
Number of Computers
| Gender |
Frequency |
Percent |
Valid Percent |
Cumulative Percent |
|---|
| . |
Valid |
0 |
2
| 5.9
| 5.9
| 5.9
|
|---|
| 1 |
12
| 35.3
| 35.3
| 41.2
|
|---|
| 2 |
10
| 29.4
| 29.4
| 70.6
|
|---|
| 3 or more |
10
| 29.4
| 29.4
| 100.0
|
|---|
| Total |
34
| 100.0
| 100.0
|
|
|---|
| Female |
Valid |
0 |
10
| 1.3
| 1.3
| 1.3
|
|---|
| 1 |
314
| 40.7
| 40.7
| 42.0
|
|---|
| 2 |
242
| 31.3
| 31.3
| 73.3
|
|---|
| 3 or more |
206
| 26.7
| 26.7
| 100.0
|
|---|
| Total |
772
| 100.0
| 100.0
|
|
|---|
| Male |
Valid |
0 |
50
| 2.6
| 2.6
| 2.6
|
|---|
| 1 |
652
| 34.2
| 34.2
| 36.9
|
|---|
| 2 |
566
| 29.7
| 29.7
| 66.6
|
|---|
| 3 or more |
636
| 33.4
| 33.4
| 100.0
|
|---|
| Total |
1904
| 100.0
| 100.0
|
|
|---|
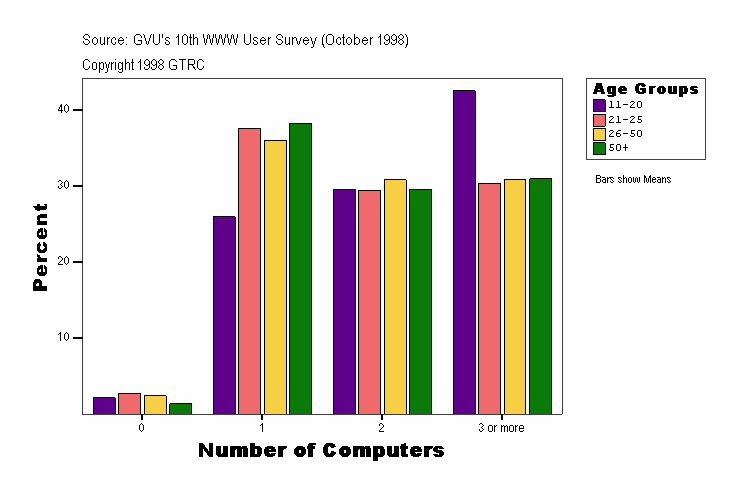
Number of Computers
| Age Groups |
Frequency |
Percent |
Valid Percent |
Cumulative Percent |
|---|
| . |
Valid |
0 |
3
| 4.1
| 4.1
| 4.1
|
|---|
| 1 |
28
| 37.8
| 37.8
| 41.9
|
|---|
| 2 |
19
| 25.7
| 25.7
| 67.6
|
|---|
| 3 or more |
24
| 32.4
| 32.4
| 100.0
|
|---|
| Total |
74
| 100.0
| 100.0
|
|
|---|
| 11-20 |
Valid |
0 |
3
| 2.2
| 2.2
| 2.2
|
|---|
| 1 |
36
| 25.9
| 25.9
| 28.1
|
|---|
| 2 |
41
| 29.5
| 29.5
| 57.6
|
|---|
| 3 or more |
59
| 42.4
| 42.4
| 100.0
|
|---|
| Total |
139
| 100.0
| 100.0
|
|
|---|
| 21-25 |
Valid |
0 |
9
| 2.7
| 2.7
| 2.7
|
|---|
| 1 |
125
| 37.5
| 37.5
| 40.2
|
|---|
| 2 |
98
| 29.4
| 29.4
| 69.7
|
|---|
| 3 or more |
101
| 30.3
| 30.3
| 100.0
|
|---|
| Total |
333
| 100.0
| 100.0
|
|
|---|
| 26-50 |
Valid |
0 |
41
| 2.4
| 2.4
| 2.4
|
|---|
| 1 |
617
| 36.0
| 36.0
| 38.4
|
|---|
| 2 |
527
| 30.7
| 30.7
| 69.1
|
|---|
| 3 or more |
529
| 30.9
| 30.9
| 100.0
|
|---|
| Total |
1714
| 100.0
| 100.0
|
|
|---|
| 50+ |
Valid |
0 |
6
| 1.3
| 1.3
| 1.3
|
|---|
| 1 |
172
| 38.2
| 38.2
| 39.6
|
|---|
| 2 |
133
| 29.6
| 29.6
| 69.1
|
|---|
| 3 or more |
139
| 30.9
| 30.9
| 100.0
|
|---|
| Total |
450
| 100.0
| 100.0
|
|
|---|
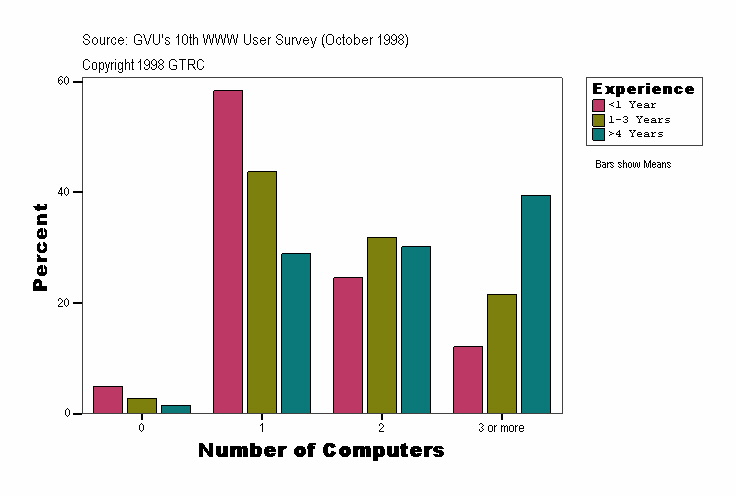
Number of Computers
| Experience |
Frequency |
Percent |
Valid Percent |
Cumulative Percent |
|---|
| . |
Valid |
0 |
2
| 5.9
| 5.9
| 5.9
|
|---|
| 1 |
12
| 35.3
| 35.3
| 41.2
|
|---|
| 2 |
10
| 29.4
| 29.4
| 70.6
|
|---|
| 3 or more |
10
| 29.4
| 29.4
| 100.0
|
|---|
| Total |
34
| 100.0
| 100.0
|
|
|---|
| <1 Year |
Valid |
0 |
12
| 5.0
| 5.0
| 5.0
|
|---|
| 1 |
140
| 58.3
| 58.3
| 63.3
|
|---|
| 2 |
59
| 24.6
| 24.6
| 87.9
|
|---|
| 3 or more |
29
| 12.1
| 12.1
| 100.0
|
|---|
| Total |
240
| 100.0
| 100.0
|
|
|---|
| 1-3 Years |
Valid |
0 |
23
| 2.8
| 2.8
| 2.8
|
|---|
| 1 |
360
| 43.7
| 43.7
| 46.5
|
|---|
| 2 |
263
| 31.9
| 31.9
| 78.4
|
|---|
| 3 or more |
178
| 21.6
| 21.6
| 100.0
|
|---|
| Total |
824
| 100.0
| 100.0
|
|
|---|
| >4 Years |
Valid |
0 |
25
| 1.6
| 1.6
| 1.6
|
|---|
| 1 |
466
| 28.9
| 28.9
| 30.5
|
|---|
| 2 |
486
| 30.1
| 30.1
| 60.6
|
|---|
| 3 or more |
635
| 39.4
| 39.4
| 100.0
|
|---|
| Total |
1612
| 100.0
| 100.0
|
|
|---|
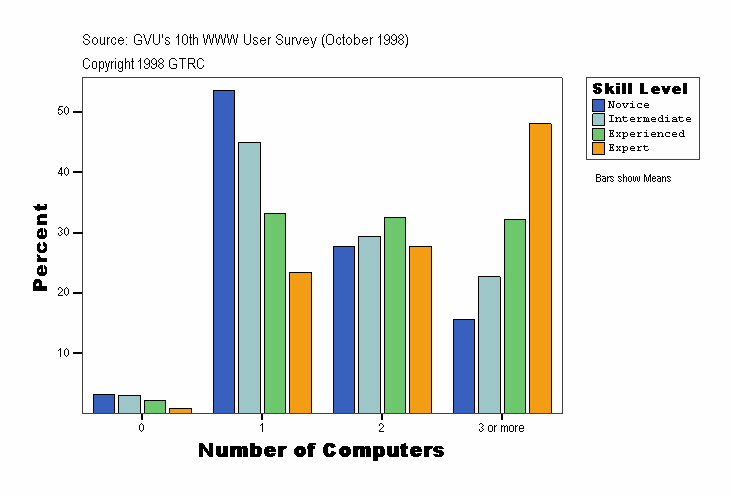
Number of Computers
| Skill Level |
Frequency |
Percent |
Valid Percent |
Cumulative Percent |
|---|
| . |
Valid |
0 |
2
| 5.9
| 5.9
| 5.9
|
|---|
| 1 |
12
| 35.3
| 35.3
| 41.2
|
|---|
| 2 |
10
| 29.4
| 29.4
| 70.6
|
|---|
| 3 or more |
10
| 29.4
| 29.4
| 100.0
|
|---|
| Total |
34
| 100.0
| 100.0
|
|
|---|
| Novice |
Valid |
0 |
8
| 3.1
| 3.1
| 3.1
|
|---|
| 1 |
137
| 53.5
| 53.5
| 56.6
|
|---|
| 2 |
71
| 27.7
| 27.7
| 84.4
|
|---|
| 3 or more |
40
| 15.6
| 15.6
| 100.0
|
|---|
| Total |
256
| 100.0
| 100.0
|
|
|---|
| Intermediate |
Valid |
0 |
22
| 3.1
| 3.1
| 3.1
|
|---|
| 1 |
321
| 44.9
| 44.9
| 48.0
|
|---|
| 2 |
210
| 29.4
| 29.4
| 77.3
|
|---|
| 3 or more |
162
| 22.7
| 22.7
| 100.0
|
|---|
| Total |
715
| 100.0
| 100.0
|
|
|---|
| Experienced |
Valid |
0 |
25
| 2.2
| 2.2
| 2.2
|
|---|
| 1 |
372
| 33.1
| 33.1
| 35.3
|
|---|
| 2 |
366
| 32.6
| 32.6
| 67.9
|
|---|
| 3 or more |
361
| 32.1
| 32.1
| 100.0
|
|---|
| Total |
1124
| 100.0
| 100.0
|
|
|---|
| Expert |
Valid |
0 |
5
| .9
| .9
| .9
|
|---|
| 1 |
136
| 23.4
| 23.4
| 24.3
|
|---|
| 2 |
161
| 27.7
| 27.7
| 52.0
|
|---|
| 3 or more |
279
| 48.0
| 48.0
| 100.0
|
|---|
| Total |
581
| 100.0
| 100.0
|
|
|---|
Source: GVU's Tenth WWW User Survey (Conducted October 1998)
URL:http://www.gvu.gatech.edu/user_surveys/
Copyright 1998 GTRC - ALL RIGHTS RESERVED
Contact: www-survey@cc.gatech.edu
For more information or to submit comments:
send email to www-survey@cc.gatech.edu.
GVU's WWW Surveying Team
Graphics, Visualization, & Usability Center
College of Computing
Georgia Institute of Technology
Atlanta, GA 30332-0280
