
| Political Party | All | Male | Female | USA | Europe | 19-25 | 26-50 | 50+ |
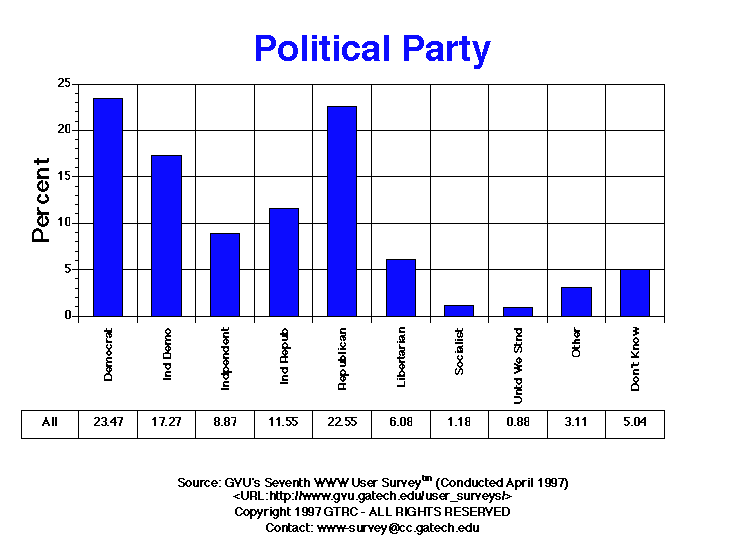
| Democrat | 3471.00 23.47% |
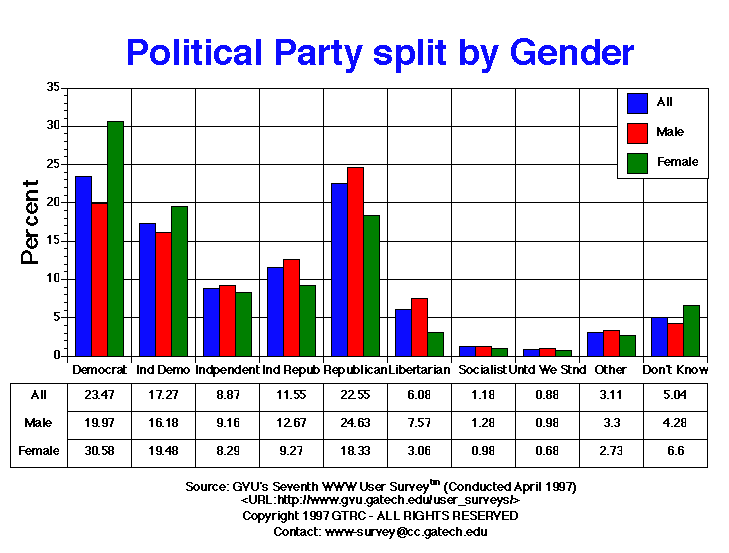
1980.00 19.97% |
1491.00 30.58% |
3471.00 23.47% |
0.00 0.00% |
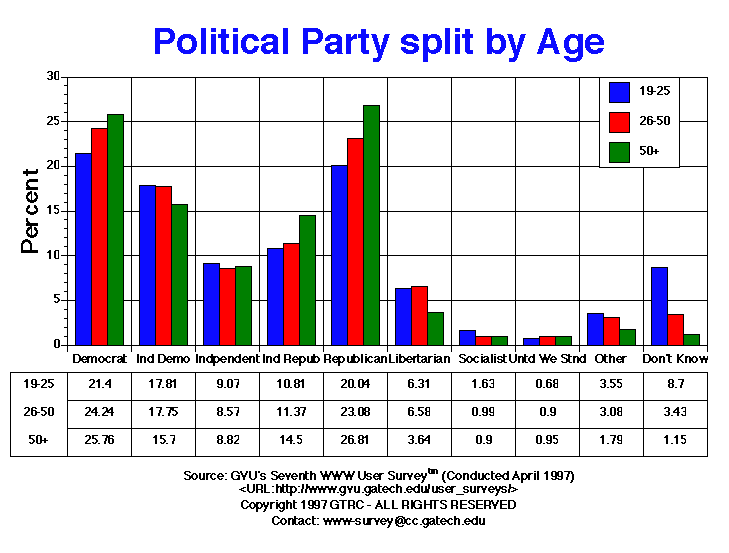
566.00 21.40% |
2178.00 24.24% |
517.00 25.76% |
| Don't Know | 746.00 5.04% |
424.00 4.28% |
322.00 6.60% |
746.00 5.04% |
0.00 0.00% |
230.00 8.70% |
308.00 3.43% |
23.00 1.15% |
| Independent Republican | 1708.00 11.55% |
1256.00 12.67% |
452.00 9.27% |
1708.00 11.55% |
0.00 0.00% |
286.00 10.81% |
1022.00 11.37% |
291.00 14.50% |
| Indpendent | 1312.00 8.87% |
908.00 9.16% |
404.00 8.29% |
1312.00 8.87% |
0.00 0.00% |
240.00 9.07% |
770.00 8.57% |
177.00 8.82% |
| Indpendent Democrat | 2554.00 17.27% |
1604.00 16.18% |
950.00 19.48% |
2554.00 17.27% |
0.00 0.00% |
471.00 17.81% |
1595.00 17.75% |
315.00 15.70% |
| Libertarian | 900.00 6.08% |
751.00 7.57% |
149.00 3.06% |
900.00 6.08% |
0.00 0.00% |
167.00 6.31% |
591.00 6.58% |
73.00 3.64% |
| Other | 460.00 3.11% |
327.00 3.30% |
133.00 2.73% |
460.00 3.11% |
0.00 0.00% |
94.00 3.55% |
277.00 3.08% |
36.00 1.79% |
| Republican | 3336.00 22.55% |
2442.00 24.63% |
894.00 18.33% |
3336.00 22.55% |
0.00 0.00% |
530.00 20.04% |
2074.00 23.08% |
538.00 26.81% |
| Socialist | 175.00 1.18% |
127.00 1.28% |
48.00 0.98% |
175.00 1.18% |
0.00 0.00% |
43.00 1.63% |
89.00 0.99% |
18.00 0.90% |
| United We Stand | 130.00 0.88% |
97.00 0.98% |
33.00 0.68% |
130.00 0.88% |
0.00 0.00% |
18.00 0.68% |
81.00 0.90% |
19.00 0.95% |


GVU's WWW Surveying Team
Graphics, Visualization, & Usability Center
College of Computing
Georgia Institute of Technology
Atlanta, GA 30332-0280