The PVaniM 2.0 system provides online and postmortem visualization
support as well as rudimentary I/O for long running,
communication-intensive PVM applications. PVaniM 2.0 provides these
features while using several techniques to keep system perturbation to
a minimum. The online graphical views provided by PVaniM 2.0 provide
insight into message communication patterns, the amount of messsages
and bytes sent, host utilization, memory utilization, and host load
information. These views are more thoroughly described below.
For online visualization analysis, PVaniM 2.0 utilizes sampling to gather
data regarding interesting aspects of the application as well as
interesting aspects of the cluster environment. With sampling,
necessary statistics are collected and sent to the monitor
intermittently. The rate at which the application data is sent to the monitor
is a parameter that may be set by the user. The user may wish to have the
statistics sent to the monitor every 5 seconds, every 30 seconds, once a
minute, etc. With lower sampling rates, the application will experience
less perturbation, but the graphical views will not be updated as
frequently. Currently, PVaniM 2.0 uses 5 seconds as a default sampling rate.
Users are encouraged to try different sampling rates and find one that is
most suitable to their personal tastes and the needs of their application.
For offline visualization analysis, PVaniM 2.0 utilizes buffered
tracing to provide support for fine-grain visualization systems.
Currently, PVaniM produces tracefiles for the prototype
PVaniM
system. A converter is provided that allows the user to also use the
popular ParaGraph system using techniques similar to PGPVM.
All of the PVaniM 2.0 system is available via anonymous FTP from
ftp.cc.gatech.edu
as pub/people/stasko/pvanimOL.tar.Z.
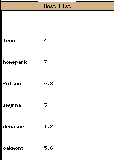
 The Host List view lists the hosts utilized and the placement of
tasks on each of
these hosts. The tasks are represented by their index in a
user-defined task array passed into the system by the application.
 The Load Information view provides insight into the load on the host machines
by providing a graphical view of the average number of jobs in the
run queue of the host.
 In the Host Utilization view, a rectangle is drawn composed of
green, yellow, and red portions. Green is used to represent the
amount of time the host spends computing, yellow represents the amount
of time the host performs PVM message sends, and red represents the
amount of time the host is idle waiting to receive PVM messages. Note
that for each host, utilization is a composition of the PVM tasks
running on that host.
 This Task Summary view provides the same information as the
Host Utilization view but provides this information on a per task
basis.
 The Memory Use view illustrates the aggregate amount of memory utilized
by the PVM tasks on each host. By clicking a mouse button on
rectangles in the Memory Use view, more detailed textual usage
statistics will be placed in olPVaniM's output box. The same
information is also available by clicking the rectangles in either the
Load Information or Host Utilization views.
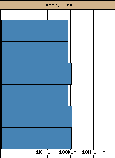
 The MESSAGES SENT/bytes sent
view provides information regarding both the number of messages
sent and the number of bytes sent. By clicking with the mouse on the
``MESSAGES SENT/bytes sent'' label, the user may interactively
choose the type of information presented by this view. It is worth
mentioning that this view does not present aggregate statistics
but instead only interval statistics. That is, the view illustrates
how much message traffic has occurred by a task since the last
time it reported statistics to the monitor.
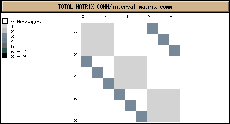
 The TOTAL MATRIX COMM/interval matrix comm view provides both
aggregate and interval statistics regarding message communication. In
this view, a row of squares is provided for each task where each
square represents how much communication occurs between that task and
the task associated with the square. In its default form, this view
provides aggregate statistics and the message key scales as the number
of messages increases. By clicking with the mouse on the ``TOTAL
MATRIX COMM/interval matrix comm'' label, the view switches to
providing this information on an interval basis. That is, the
squares are colored using only messages sent since the last time the
task reported to the monitor. When used in this mode, it is not clear
what the range values should be for the message legend. Because of
this, the user is allowed to interactively change the range values of
the message legend to find a range most appropriate for the phase of
the application. By clicking the right or middle mouse button, the
range values increase. By clicking the left mouse button, the range
values decrease.


The PVaniM 2.0 system provides routines similar to scanf()
and printf() that allow for rudimentary input/output with
the executing application. When the graphical monitor is used, the
output routines are directed to the PVaniM 2.0 output box and input is
mapped to the PVaniM 2.0 input box. When the monitor is not in use,
these routines default to standard printf() and
scanf() if the PVM task is connected to a terminal. This
allows for many programs to prompt correctly for application
parameters whether or not the graphical monitor is being utilized.
Back to Software Visualization Home Page
Questions or comments? Email
gvu-webmaster@cc.gatech.edu.
|

