|
This page provides a number of examples of POLKA
visualizations/animations of parallel programs.
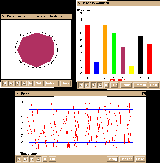 This animation shows a variety of performance views built with Polka:
a Kiviat diagram, a wokload bar chart, and a Feynman diagram.
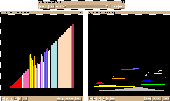 This is an animation of a parallel quicksort program on the KSR. The
left view shows the values being sorted (color indicates thread) and
the right view shows a history of the swaps made in the program.
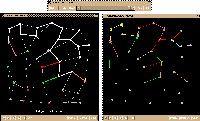 This is an animation of a parallel minimum spanning tree program. The
left view shows the graph and the spanning tree growing inside it.
The right view shows the "closest" data structure maintained by the program.
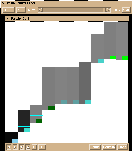 This image shows a view of a sort of 50,000 elements. Each bar maps
to 10% of the total array of elements. The darker a bar, the more
sorted it is. The blue line in the center indicates average value of
all elements in that part (along the vertical dimension). The tops
and bottoms of the parts indicate max and min values in that section.
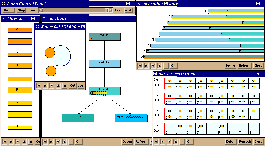 This is a view of a Pthread program on the KSR. These views are
implemented in the GThreads view library.
|
|
|
|
|

